Introduction
The history graph is just that – a graph of the sites you’ve visited. This is very useful to keep track of where you’ve been. In many investigation the analyst can’t retrace the steps he/she took to get to a piece of information. The graph provides a nice way to archive your journey.
It also allows you to take multiple screenshots of website and store it in the graph.
Switching recording on/off
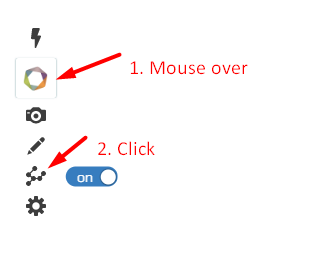
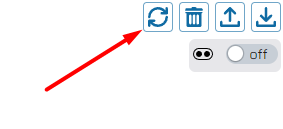
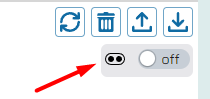
By default the extension keeps track of where you’ve been. But if you want to switch it off you can toggle recording by hovering over the nugget, going to the History Graph icon and switching it off - like this:

The history is also disabled for a list of sites. You can easily add your own sites in here too:
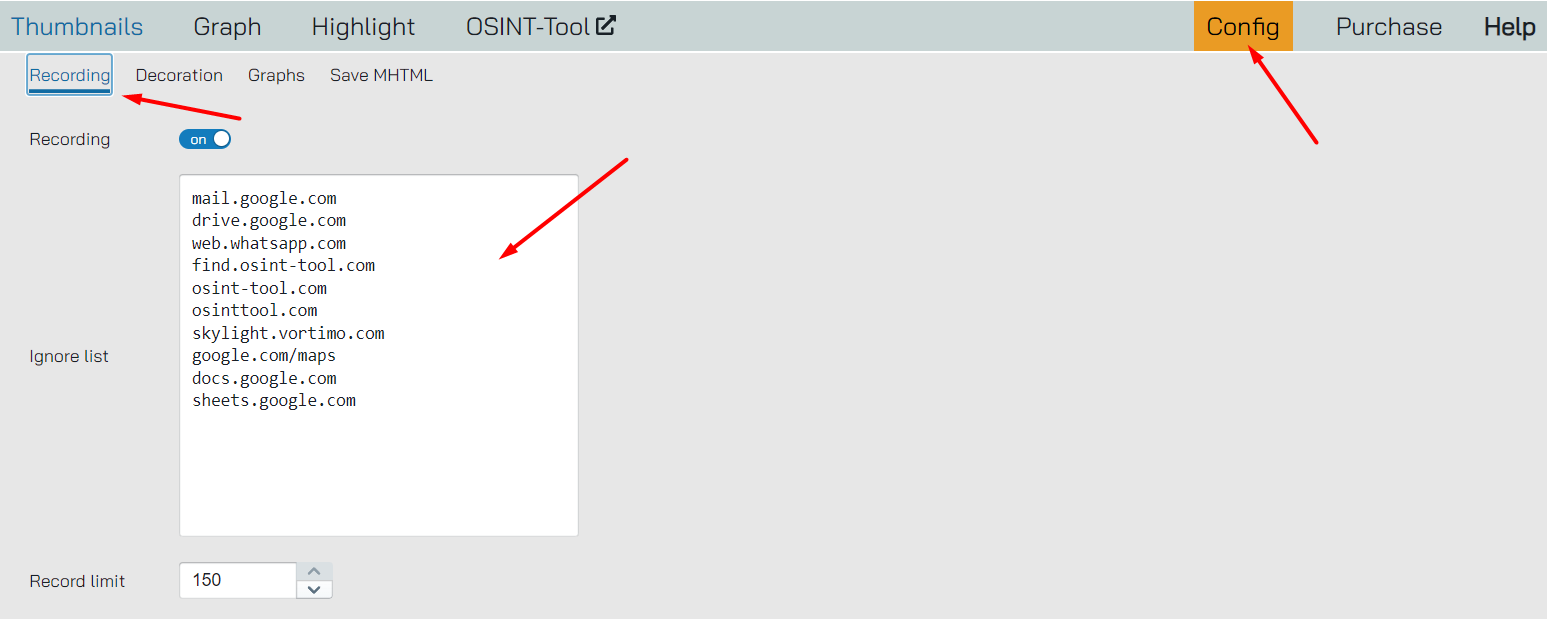
You can see you can switch recording on/off here too.
Getting to the graph
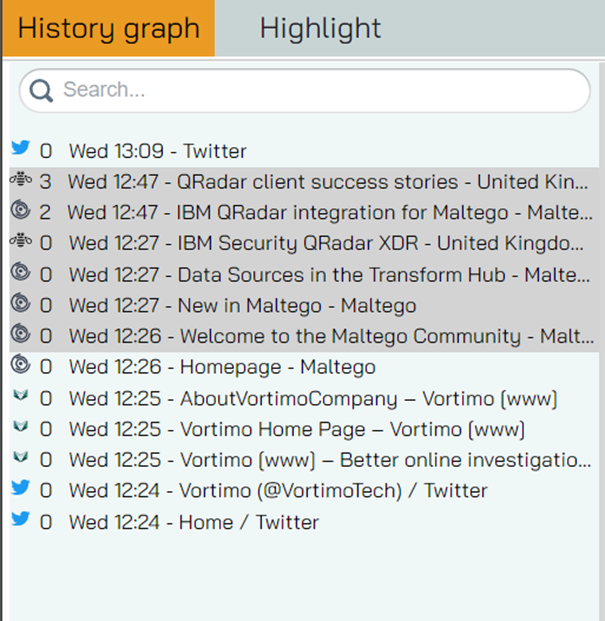
To get to the actual graph you can either go to the ‘History Graph’ tab in the extension’s page or click on the History graph icon on the nugget:
Keep in mind that you might have no nodes on the graph if you haven’t navigated around a bit.
Navigating the graph
Once you’ve visited a few sites, browsed around you should see nodes on the graph. If you don’t – make sure that recording is switched on.
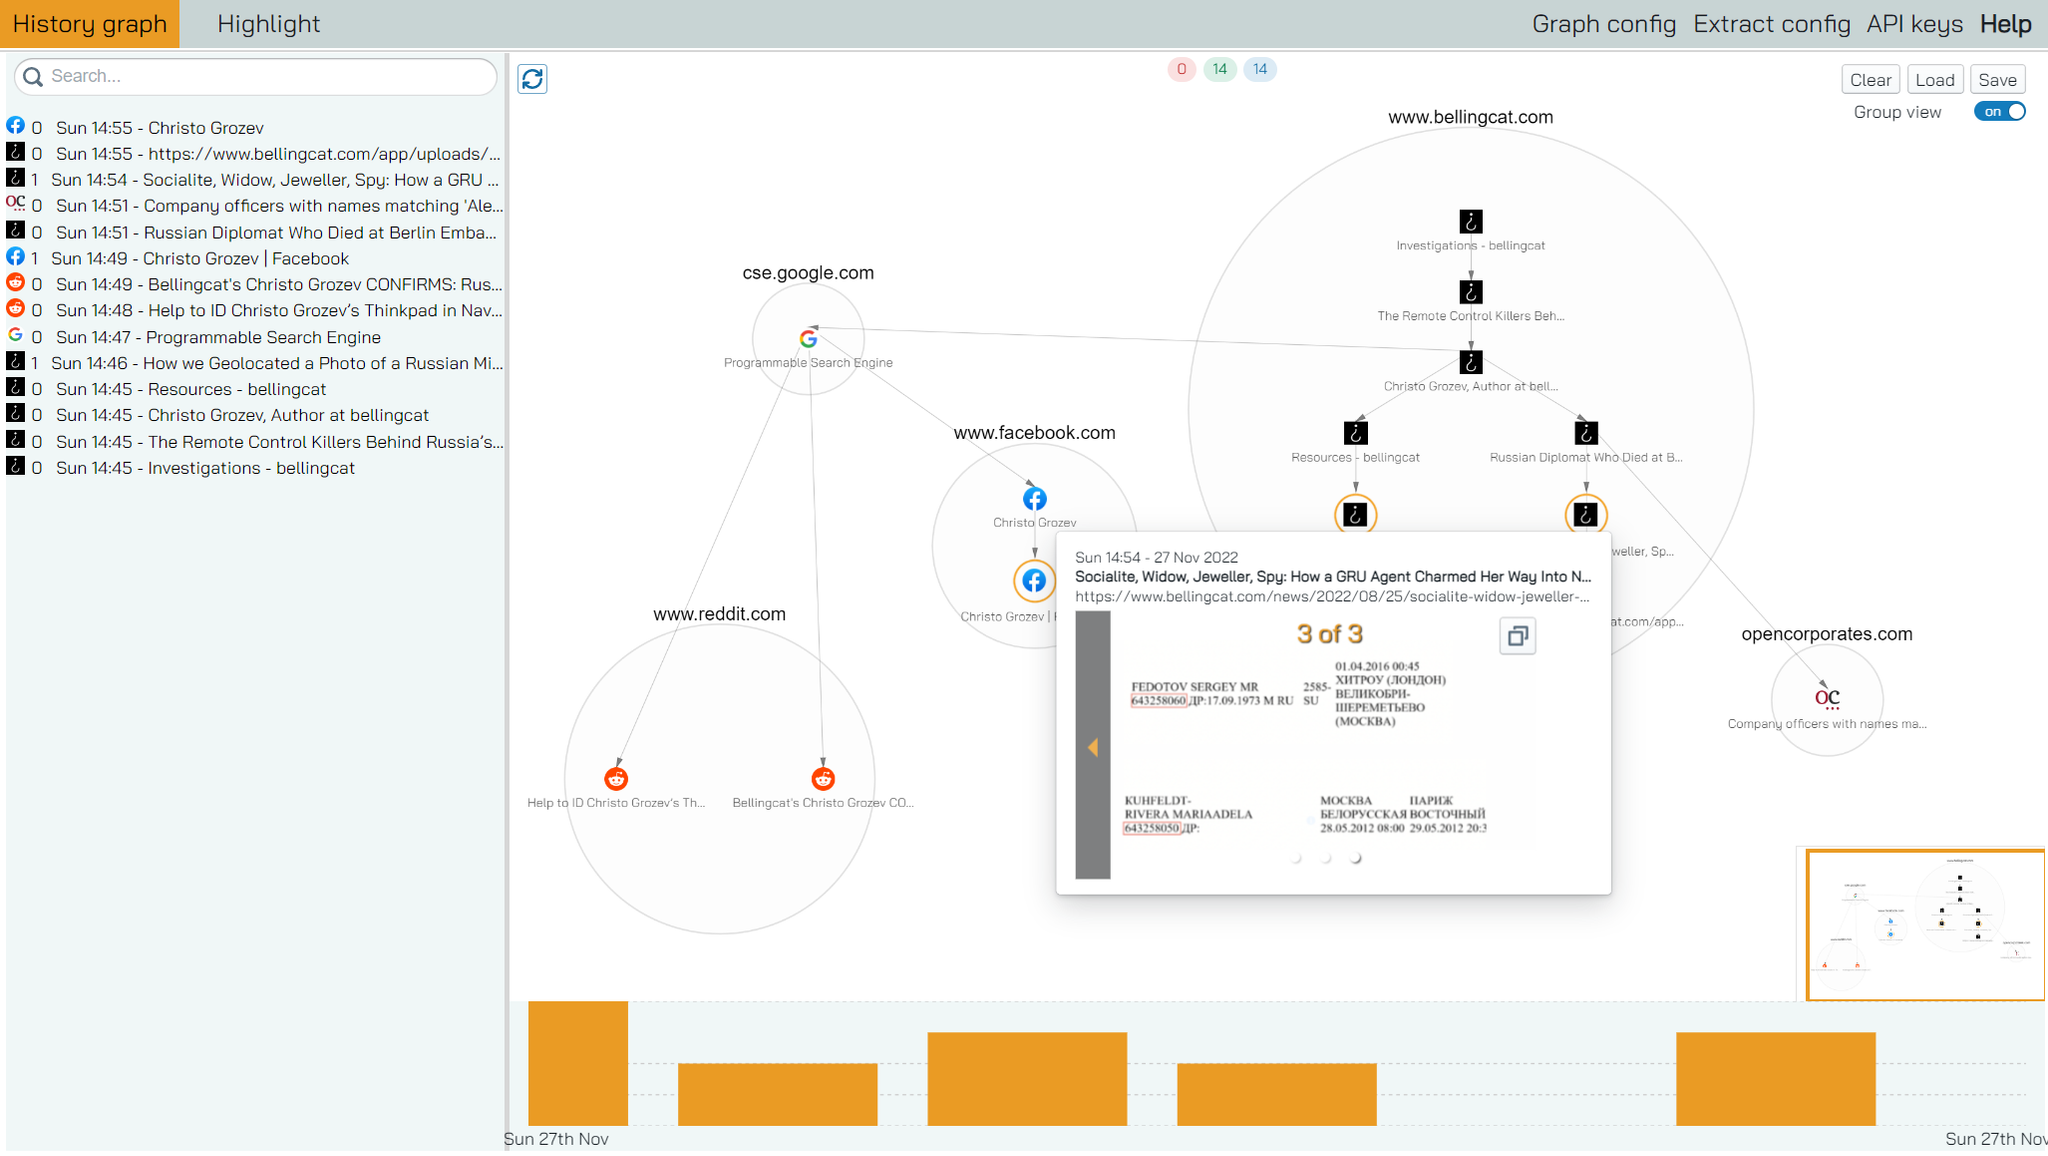
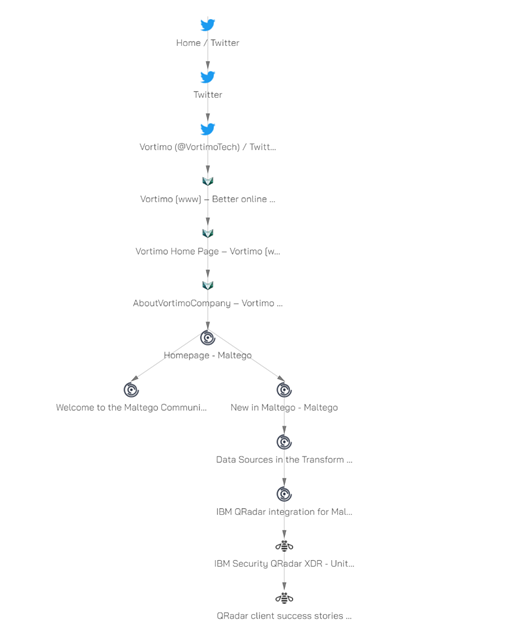
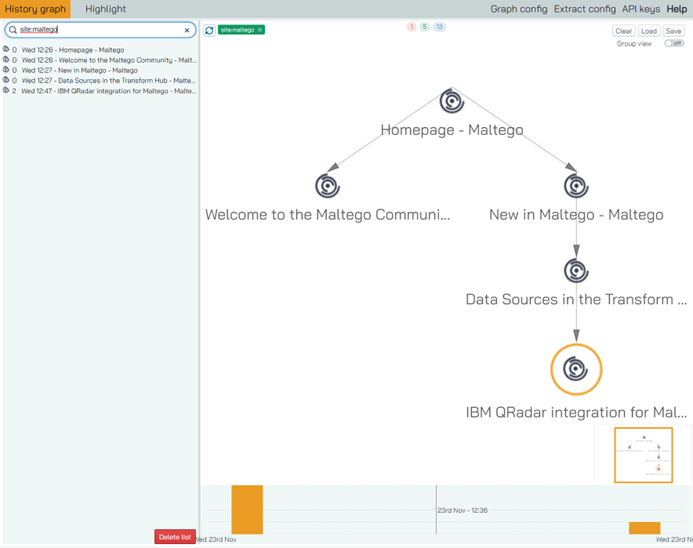
It should look something like this:
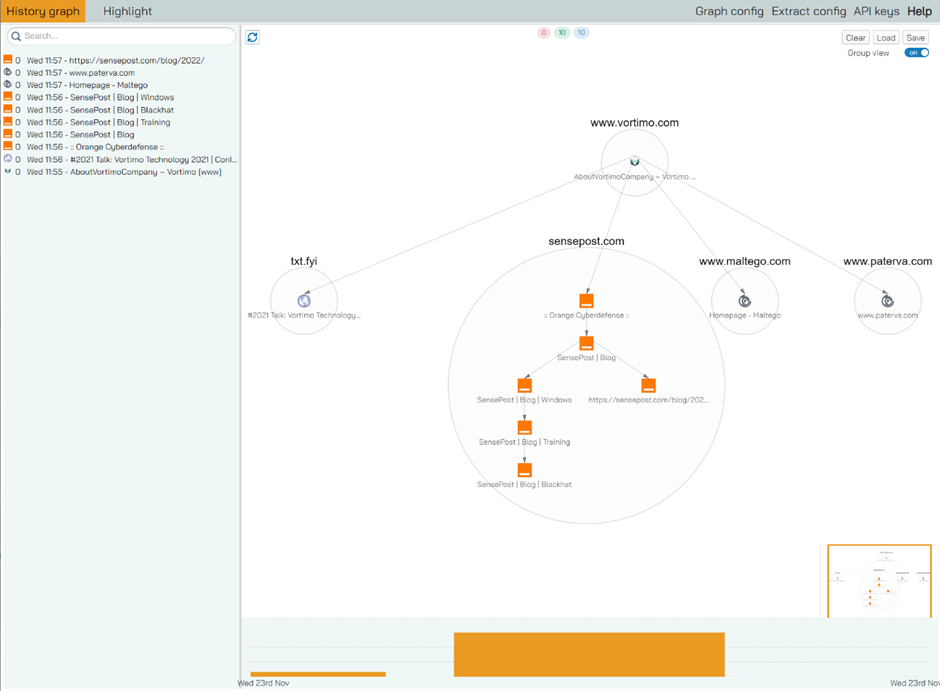
Obviously your screen would look different – because you’re probably going to visit others sites 😉.
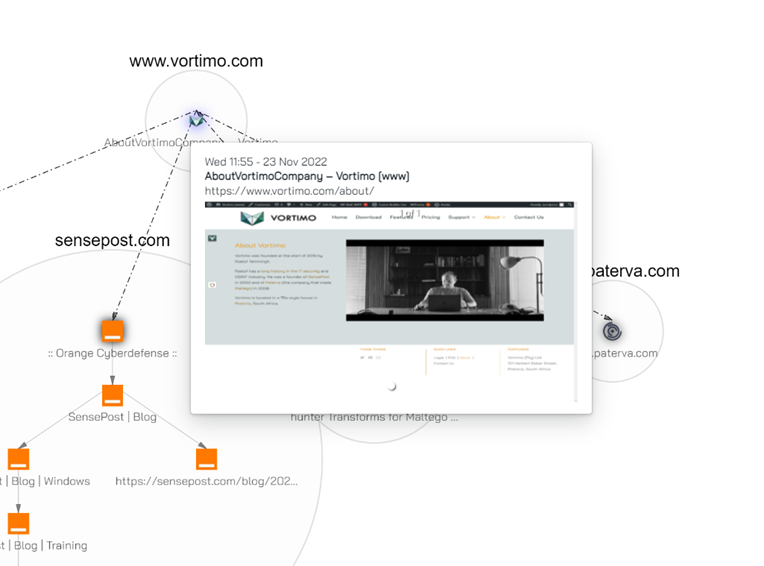
To pan the graph around, just click on any open space and drag the mouse around. When you hover over a node, you’ll see the last screenshot taken from the site pop-up:
[edit 2023-03 — with the new version there are no longer pop-ups - this information is now displayed in a dedicated panel on the right. We did this because we found that the pop-ups kind of ruined the navigation experience. And because with the object view we had to have the side panel anyhow]
Screenshots are taken when you enter or exit a page or when a change in the page is detected. You can also take your own screenshots - see the relevant section in this document.
Additionally, in the temporal view at the bottom – the timeline – you’ll see a one-pixel gray line and a date and time:
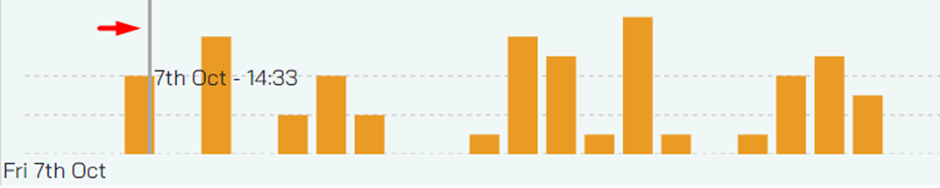
This line shows you the last time you’ve visited that site on the timeline.
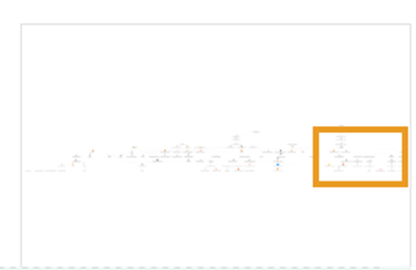
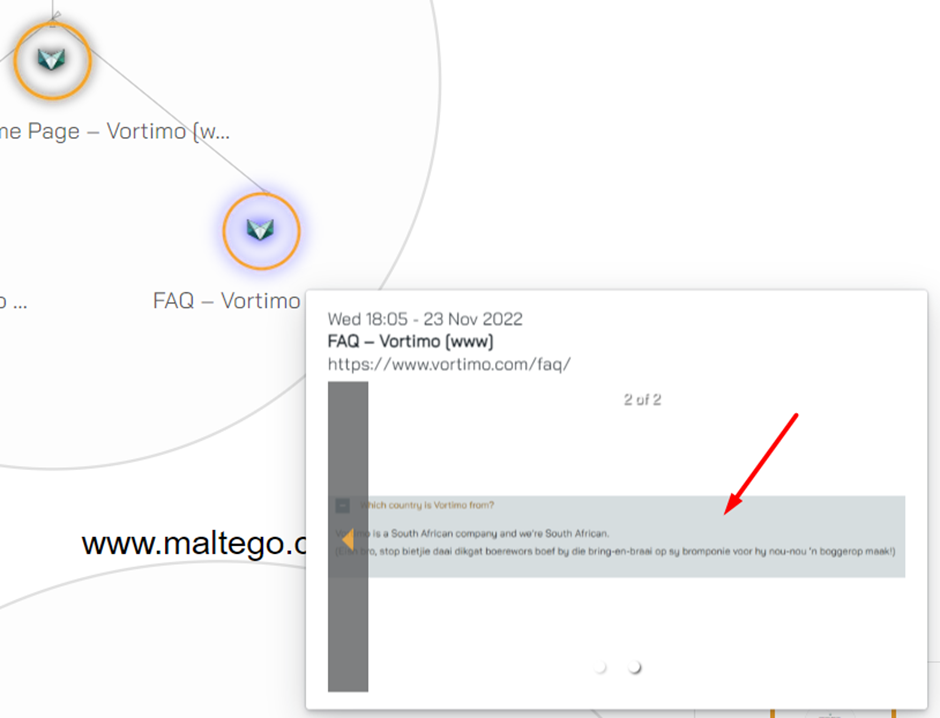
If you took additional screenshots on this site you’ll see that the node has an orange circle around it:
The circle indicated that there are multiple screenshots attached to the node. This is a nice way to mark important sites too!
On the right-hand side bottom of the graph you’ll see a smaller window – this helps you to know what portion of the graph is in view:
You can also rapidly navigate the graph using this mini-map.
You can move nodes around as you wish but keep in mind that it will automatically re-layout when new data arrives. In effect this means that moving nodes around are only useful when you want to take a screenshot and want to show something specific.
You can also force a re-layout by clicking on the layout button on the right top corner:
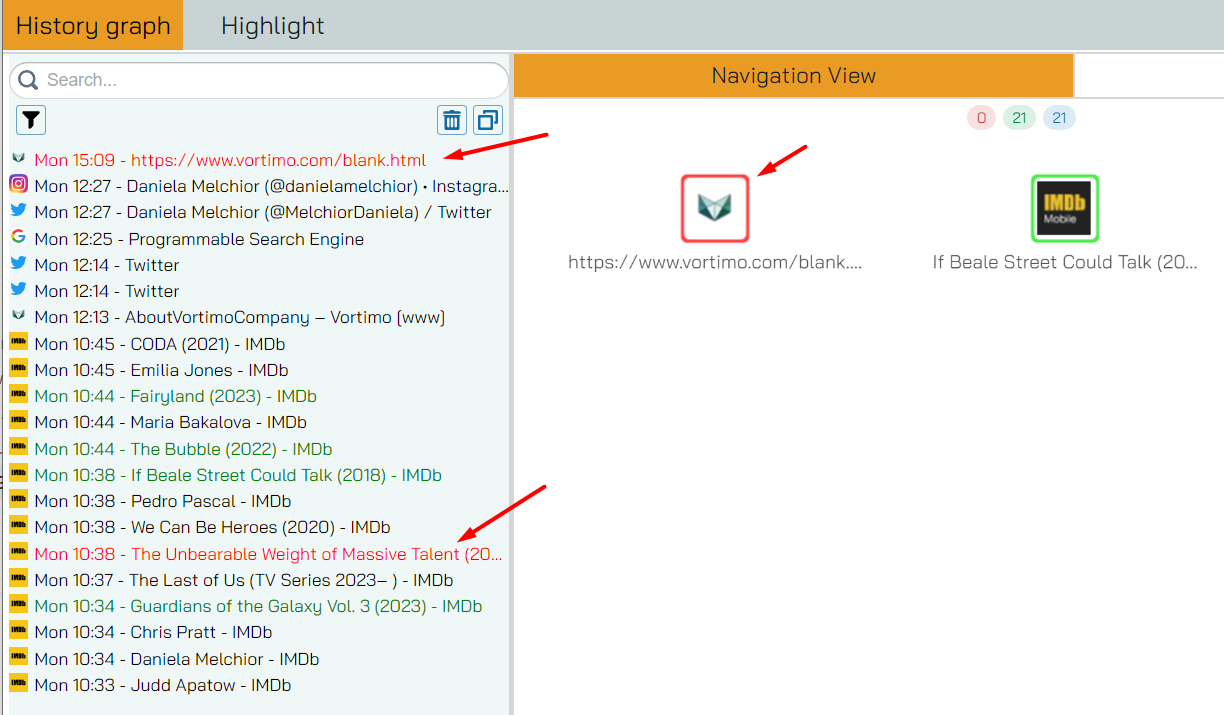
You’ll see three numbers at the top of every graph:
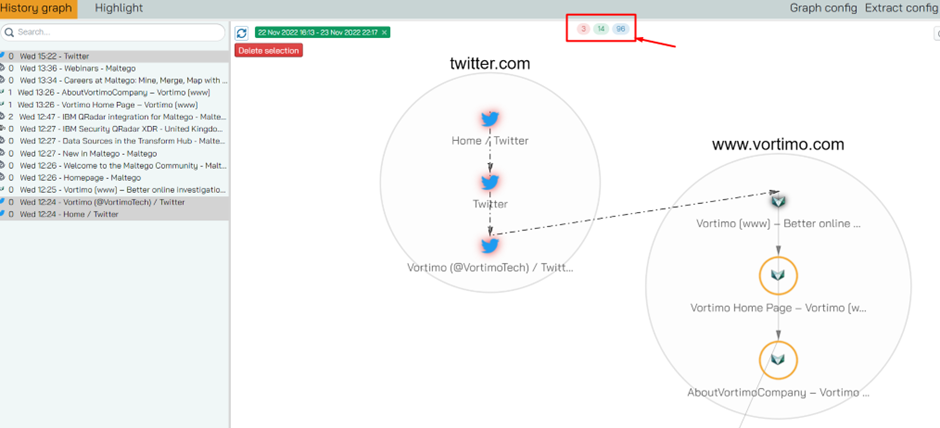
These show you selected nodes (three in the picture), visible nodes (14 in the picture, since there is a time filter applied) and total number of nodes. This gives you a good indication of resource usage.
Graph grouping
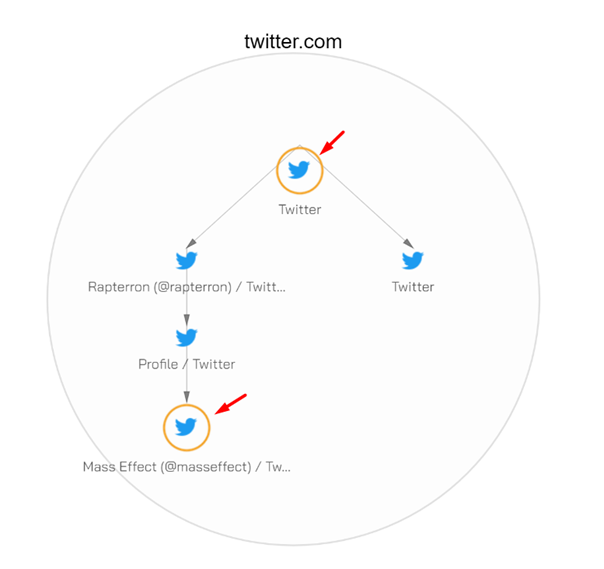
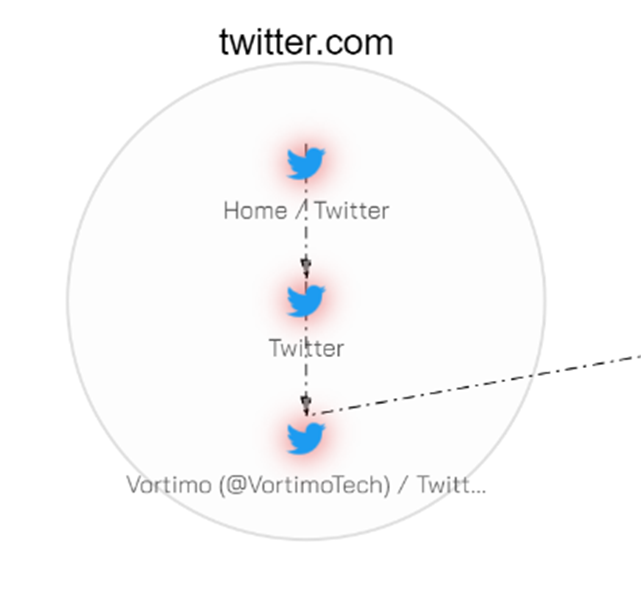
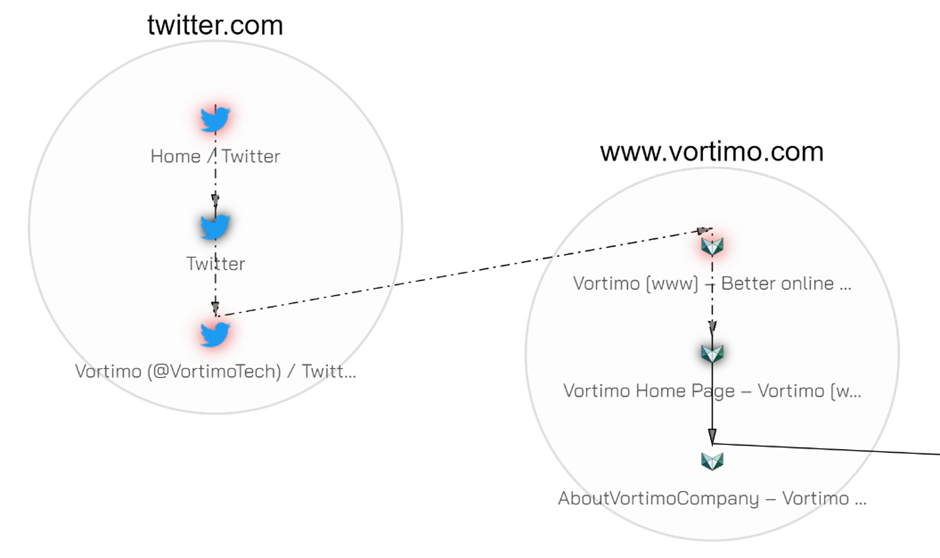
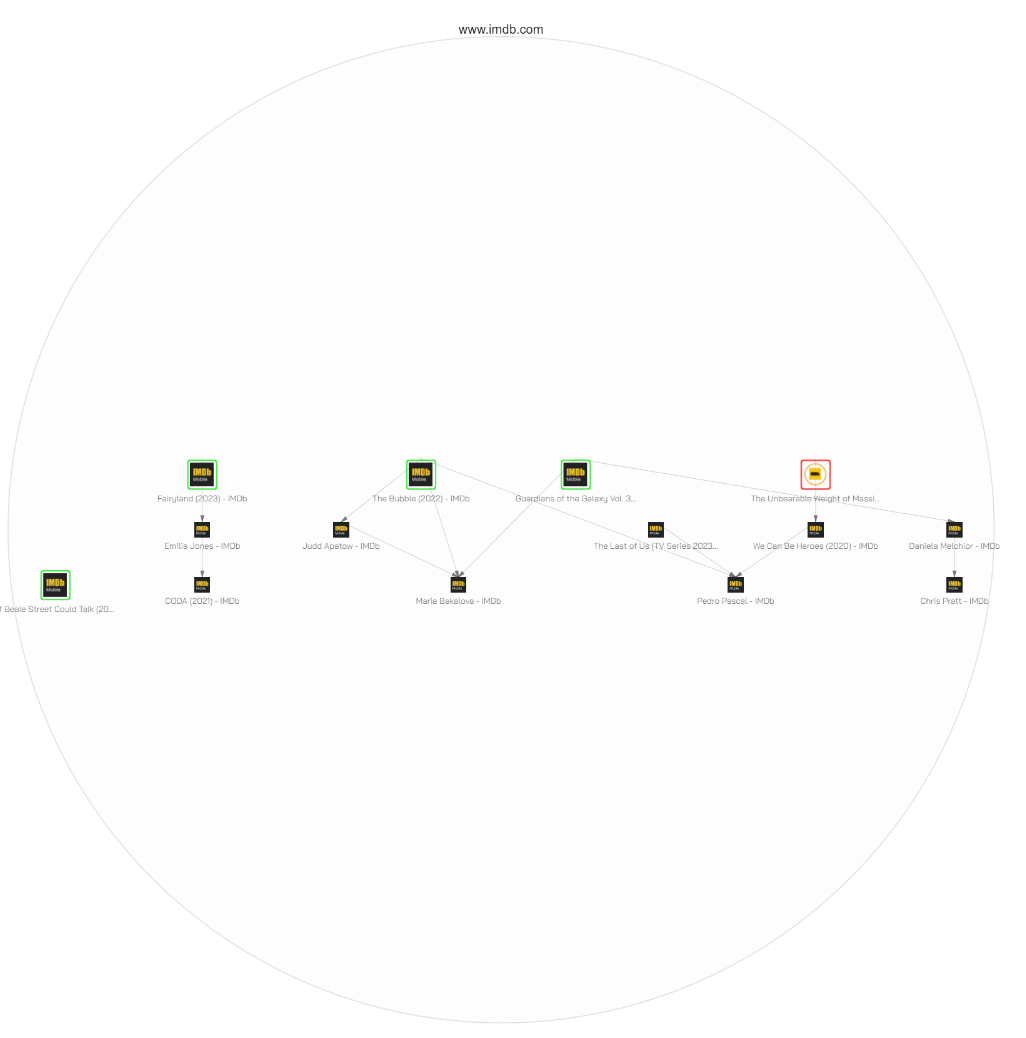
By default, the graph is grouped by site – meaning all the nodes from a site is grouped in a bubble. This makes it easy to see how you entered and exited a site without getting distracted by the detail of how you navigated inside the site. For instance, look at this:
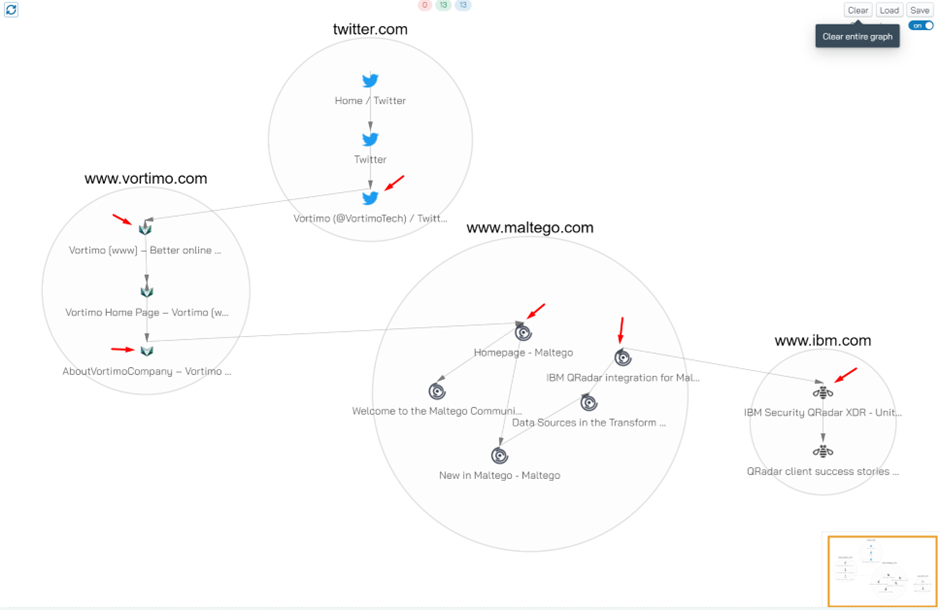
On this graph the entry and exit nodes (for each website) are indicated with red arrows. These are the nodes where the links cross a site “bubble”.
In other situations the grouping is just a bit distracting and makes reading the graph more difficult. You can easily toggle graph grouping using this button located on the top right:
The same graph, with grouping off:
We recommend that you experiment with this setting to get the most from the graph.
Selecting nodes
To select a node, click on it. You will see that it glows red. To select more than one node you can hold ALT and drag a box around the nodes you want to select:
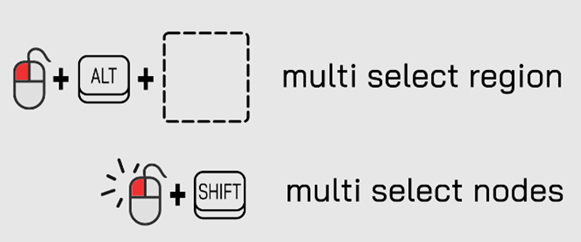
You can also select multiple – specific nodes by holding down shift and the selecting the node:
Again, selected nodes glow red.
You can also select, and multi-select (hold down ALT) nodes in the left-hand list of nodes:
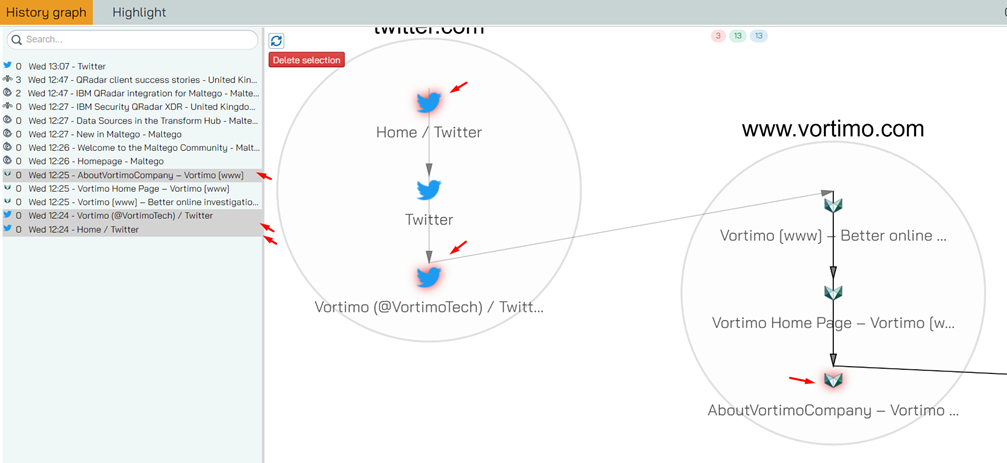
As you select nodes on the left they glow red in the graph. You can also select a range of nodes by clicking the first and the SHIFT clicking the last:
This is useful for selecting a time range. More on temporal selection in the filter section – which is next.
Taking screenshots
The History Graph tool takes screenshots when you enter and exit website – by default. But in many cases (think infinite scrollers or sites that longer than one page!) it is useful to be able to take more than one screenshot. On any site and at any time you can decide to take a screenshot of an arbitrary area of the screen in the following ways:
- Ctrl + ~ (nicely situation on the left hand side of the keyboard so you don’t need to use two hands, keeping your right hand on the mouse)
- Alt + left click (this might result in the browser saving the link, so use when you sure it’s OK)
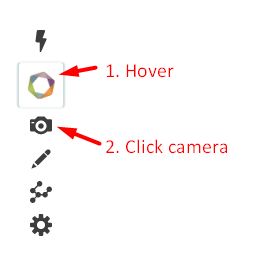
- Using the camera button on the nugget (if you forget these other, better methods):
Any of these actions will result in the cursor changing to a crosshair and allowing you to drag/mark an area on the screen:
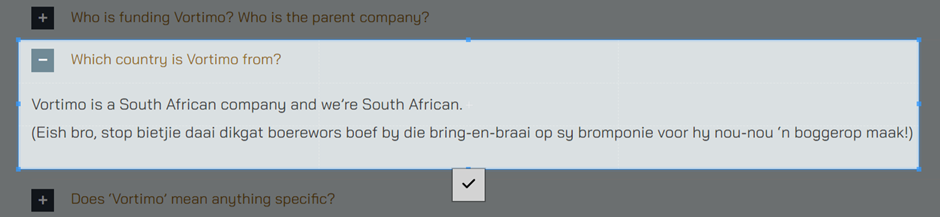
Clicking on the green tick mark (or pressing Enter) will save the screenshot to the node:
You can save multiple screenshots to the node – there’s no limitation. Nodes with screenshot show up with yellow circles around them – nice for quickly seeing where the interesting nodes are.

Bookmarking
In newer versions of the extension you are able to bookmark a website. This way you can easily retrieve the site later. When you later revisit the page it also shows you that you’ve been on the site before.
You can bookmark from the extension and see it in the UI, but you can also bookmark a site in the UI and see it in the extension.
From a webpage
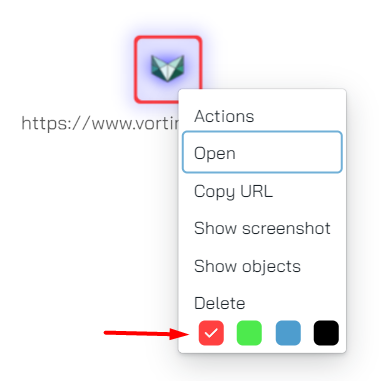
To bookmark a webpage on the page itself, click on the nugget and pick the color (the colors are fixed).
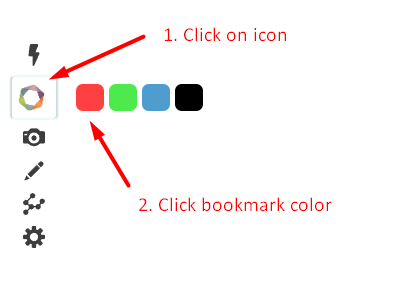
The nugget icon will now get the relevant color border around it - this will update as you visit other sites:

In the UI the webpage will show up as red (or green or blue or black):
In the screenshot above there are two pages with red bookmarks (one shown in the graph), and a few green ones (one shown in the graph).
From the UI
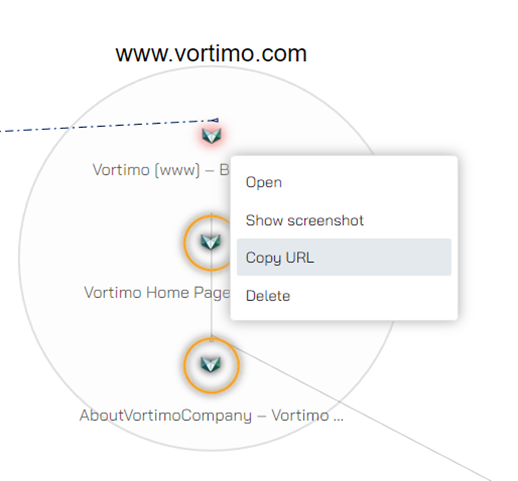
When you right click on a node (or on an item in the list) you’ll see the bookmark colors and checkboxes (if bookmarked) at the bottom:
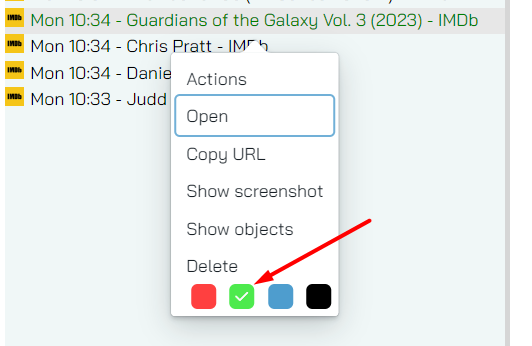
This is how you can set and unset the bookmark color. It should be clear that a webpage can only have one color bookmark at a time.
Filters
Title
In the simplest form you can filter by entering text in the search box:
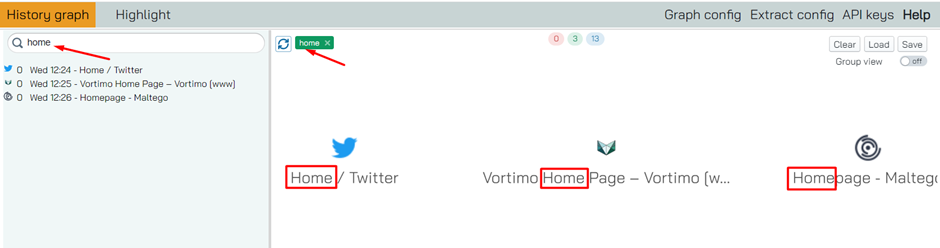
In the screenshot you see a few things. Firstly the node list on the left updated to only include sites with ‘home’ in it’s title. Secondly, the graph has been updated to reflect the same nodes. Whenever a filter is applied the graph and list always sync up. Thirdly – you can see a filter (green) at the top of the screen, showing you that you’re filtering on the word ‘home’. Lastly – it’s clear from the results that text filters are not case sensitive.
To cancel all filters – press escape (ESC).

You can also click on [x] next to the green filter crumb at the top of the screen to cancel this specific filter.
URL
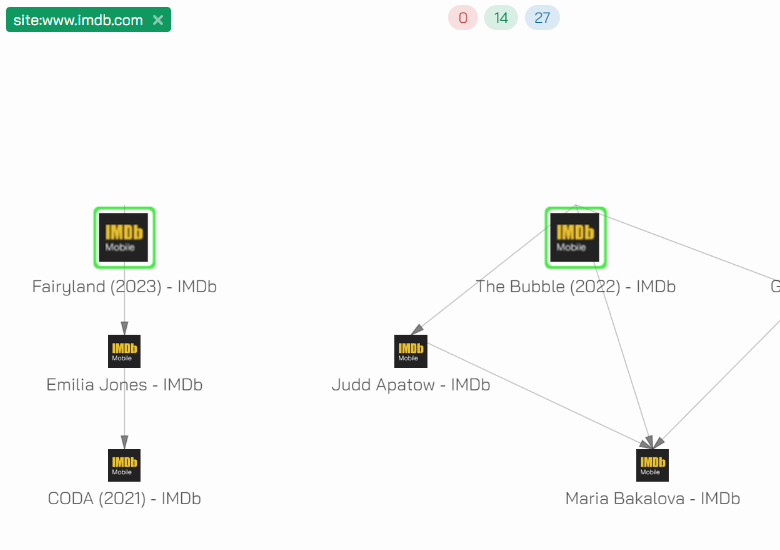
If you want to filter using the URL itself you can add the operator ‘site:’ to the query. While the correct Google operator is really ‘inurl:’ we just went with ‘site:’ because, it’s shorter and most people remember it better:
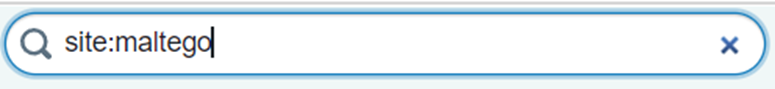
Here you’ll see the graph (and the list) updated with URLs with the word ‘maltego’ in it. This filter can be as loose or specific as you choose. For instance, if we use site:Vortimo we’ll get:
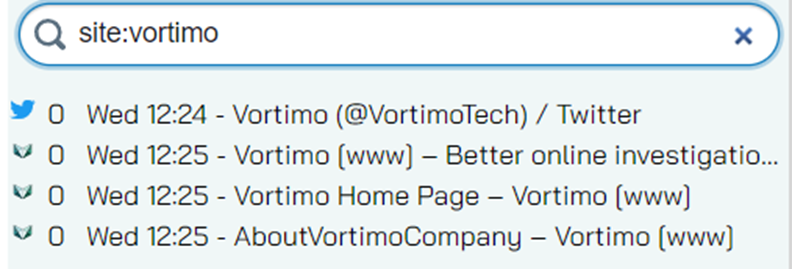
On closer inspection we see the Twitter node was included because the URL is ‘https://twitter.com/VortimoTech’ and that contains the term ‘vortimo’.
Screenshots
You can easily find nodes that have multiple screenshots by adding the operator ‘has:’. In this case it would be has:ss
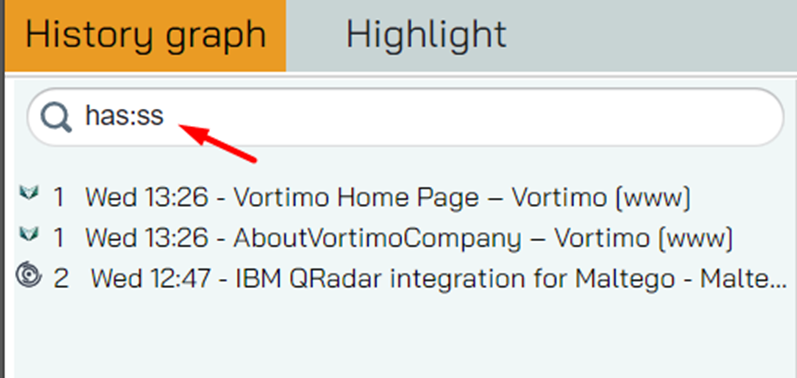
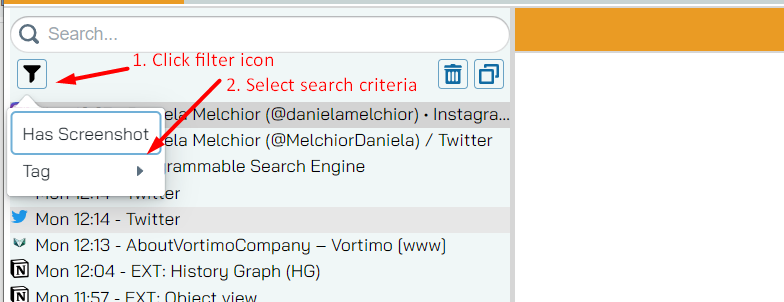
In newer version you will find a dedicated filter button here - it means you don’t need to remember this weird search language - you can just click away:
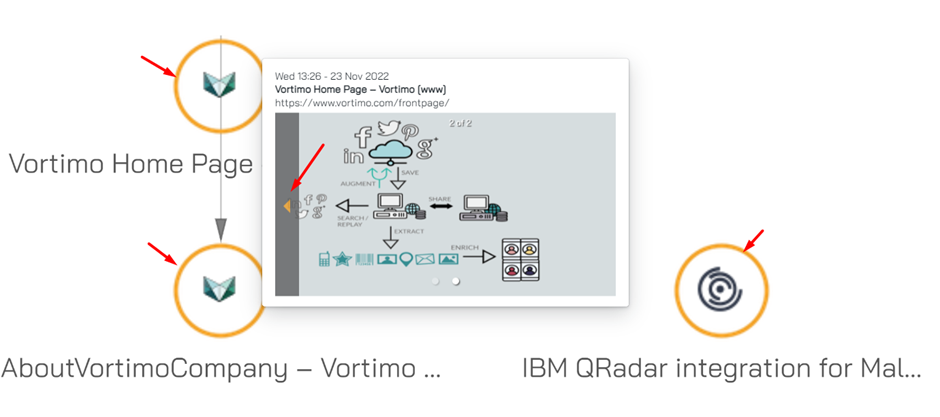
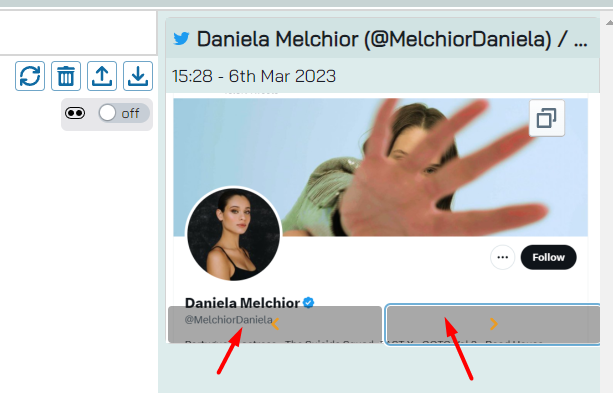
When viewing thumbnails in the right hand panel you’ll notice arrows at the side of the screenshots – this gives you the ability to cycle through screenshots you’ve taken:
When you click on the image a full size screenshot is shown:

You can navigate the full-size screenshots here too. This is the same as clicking on the ‘Show screenshot’ item in the context menu.
Images always scale to fit into the screen. But when you click on the copy button (top right) the original size is copied to the clipboard.
Temporal
When you have been working on an investigation for many days/weeks it is very useful to be able to filter on time periods. You can select the time when the node was visited by clicking at the bottom of the screen where timeline is:
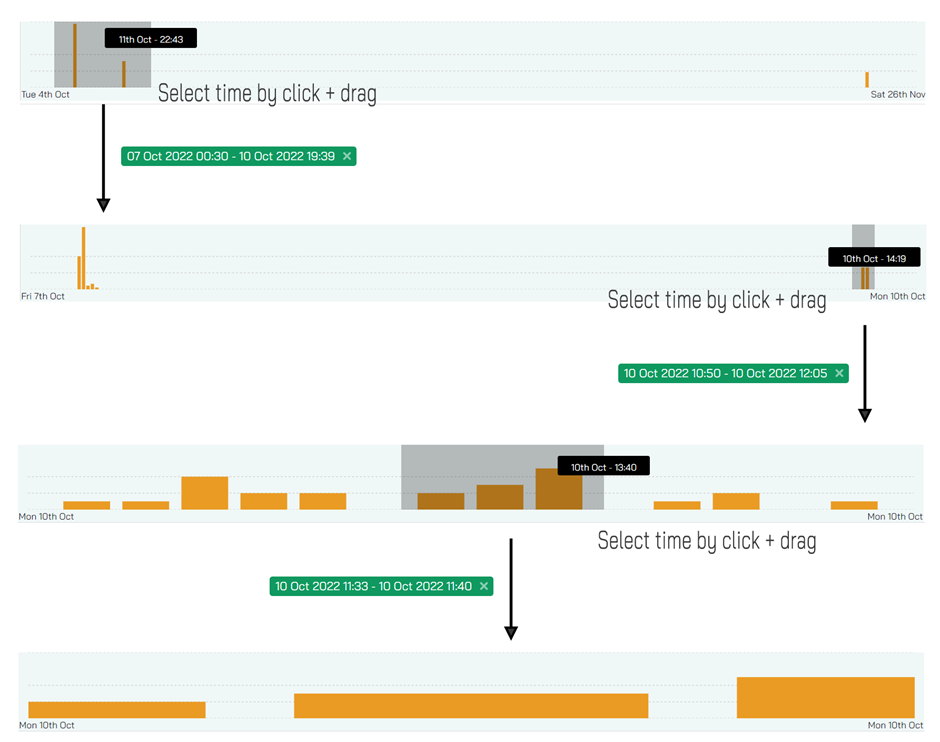
As you move your mouse over the timeline, you’ll see the date and time update where the cursor is. This is great to orientate yourself temporally. The yellow bars shows when you visited sites – the higher the bars the more sites you visited at that time.
You can select the date range by simply dragging a time frame on the graph. This will result in a filter that’s applied – the list of sites and the graph will update to show you only sites you visited in that period. The timeline will also update – you’re zooming in on a particular time (see the picture above) This is actually quite neat 😊. You’ll also see a green filter crumb at the top showing what time frame you’ve selected.
To clear filters press escape (ESC).
Temporal filters can be combined with other filters:

Quick site filter
You can quickly filter by site when in group view by clicking anywhere within a bubble. This acts as a shortcut for applying the site filter:
Again, ESC clears all filters.
Downloading and uploading
As you would expect you can save and load graphs. This is super useful for archiving your research path – as well as screenshots from sites you’ve visited. You can find this functionality in the top right corner of the graph:
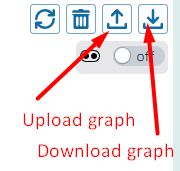
There is very little to say here – it just does what it says on the box. The only interesting bit is that uploading will APPEND nodes to the graph. This means that if you want to have a clean graph you need first clear the graph and then load the dataset. This is intended functionality.
Actions
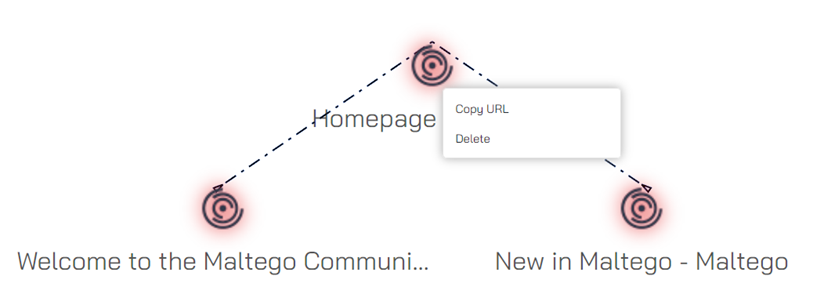
When you double click on a node it opens the URL in a new tab. When you right click on a node you get a useful context menu:
The items in the menu are pretty straightforward. When you select multiple nodes and right click the actions that applies to multiple nodes are displayed: