With the history graph we show you how sites are linked with regards to how you navigated there. With object view sites are linked by their content. By content we mean object that were extracted from page. These objects are things like names, email addresses, hashtags, IP numbers etc.
Remember how, when you visit a page with the extension enabled some object are marked with the blue dot? These objects are the ones that were extracted for this view.
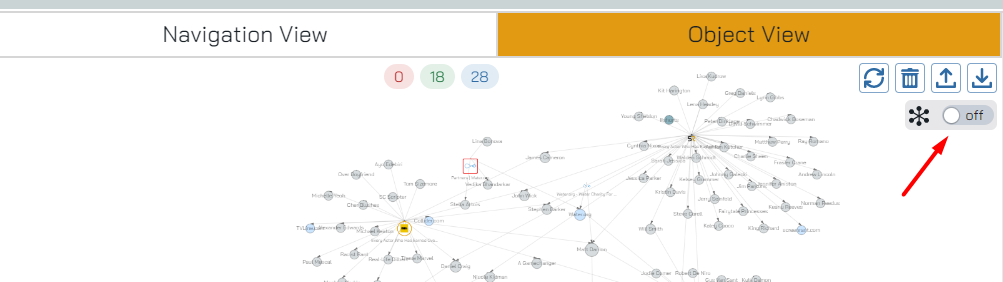
To access Object view simply click on the big bar that says “Object view” at the top. When selected it will show up as dayglo orange, and you’ll be in Object View.
Object view is one of the few few features in OSINT-tool that is commercial. Unlicensed user is allowed to spend 10 minutes looking to see if Object view is worth their hard earned money.
Overview / Panel layout
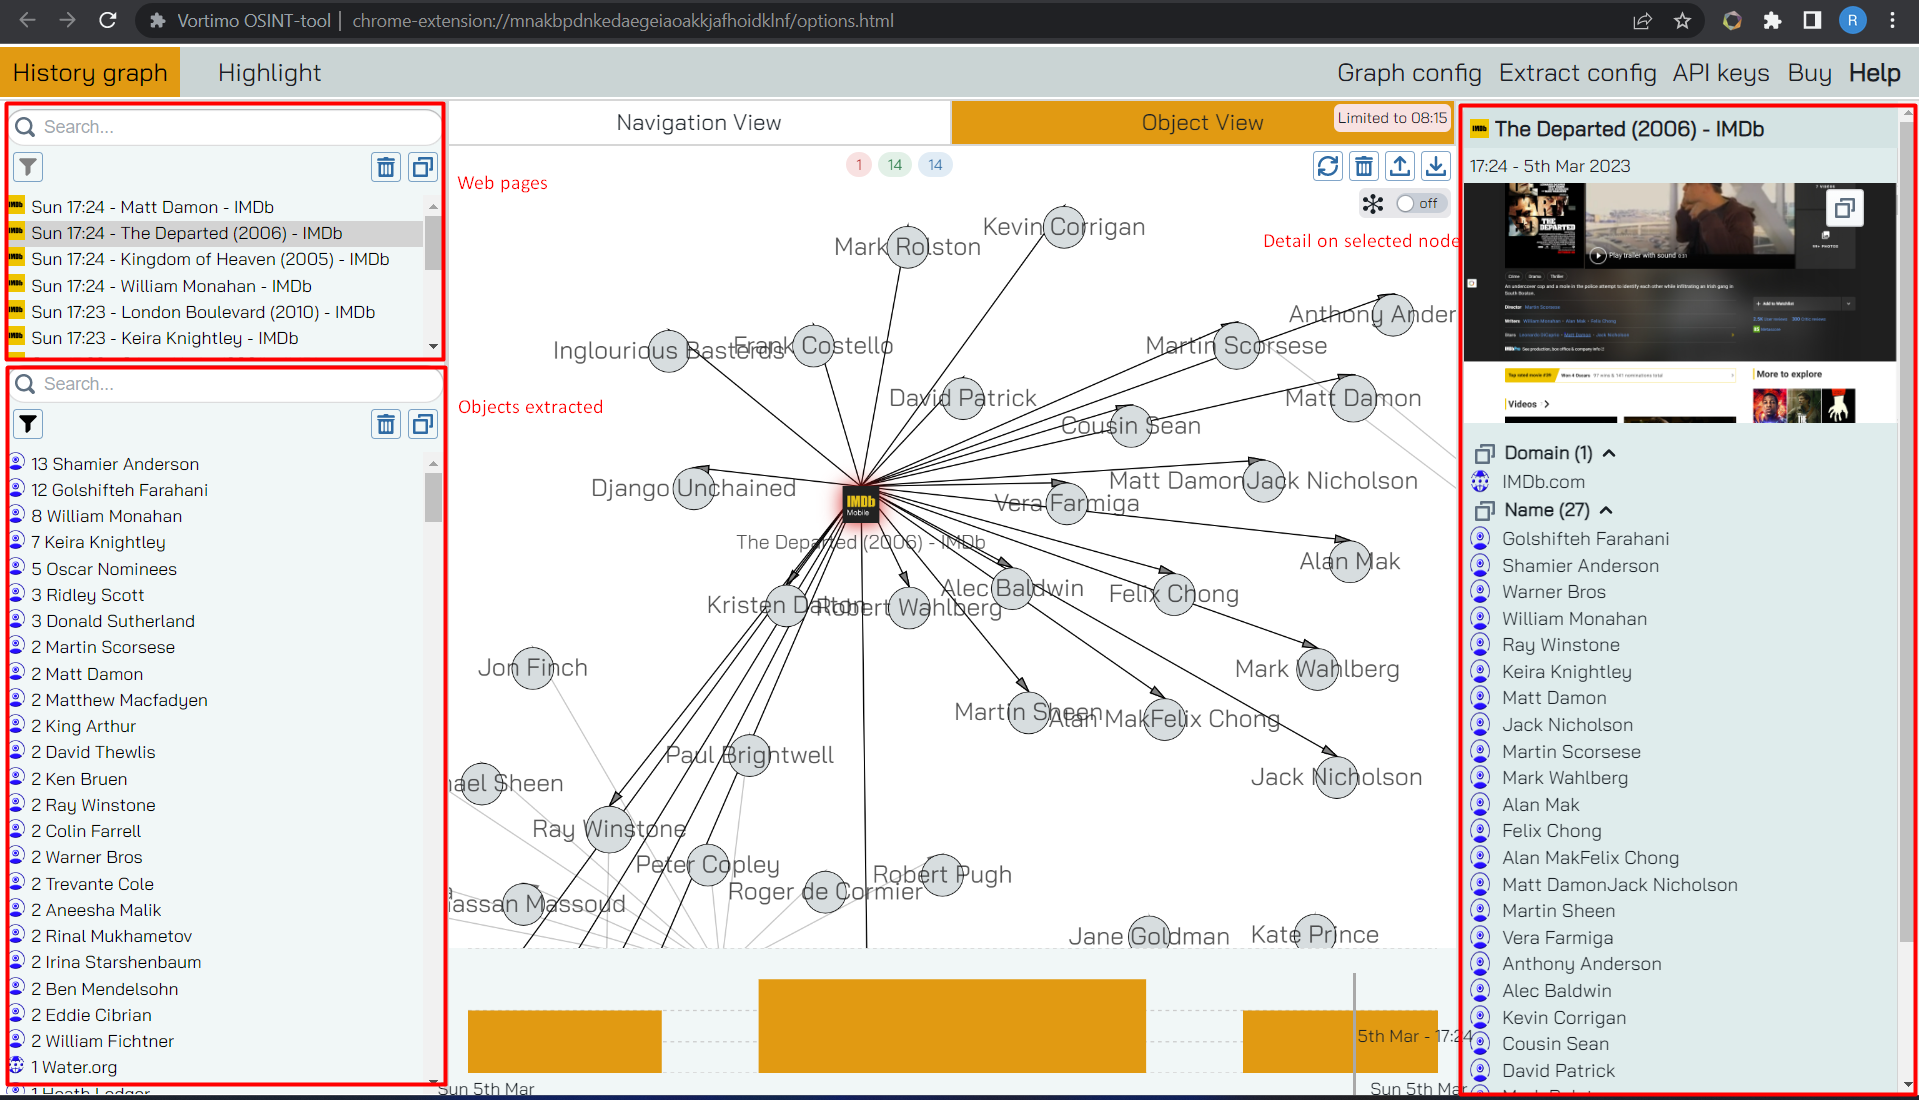
When entering object mode you’ll see the following sections:
On the top left are the websites - you should familiar with this from the Navigation View. Below that, on the left bottom are the objects. This view is a bit bigger than the website list because, hey, in this view you’re looking at objects. On the right is detail about the selected node.
In the middle is the graph, the reason you came here in the first place! As you select nodes in the graph you’ll see the right hand panel update based on the type of object you’ve selected.
URL / webpage selected
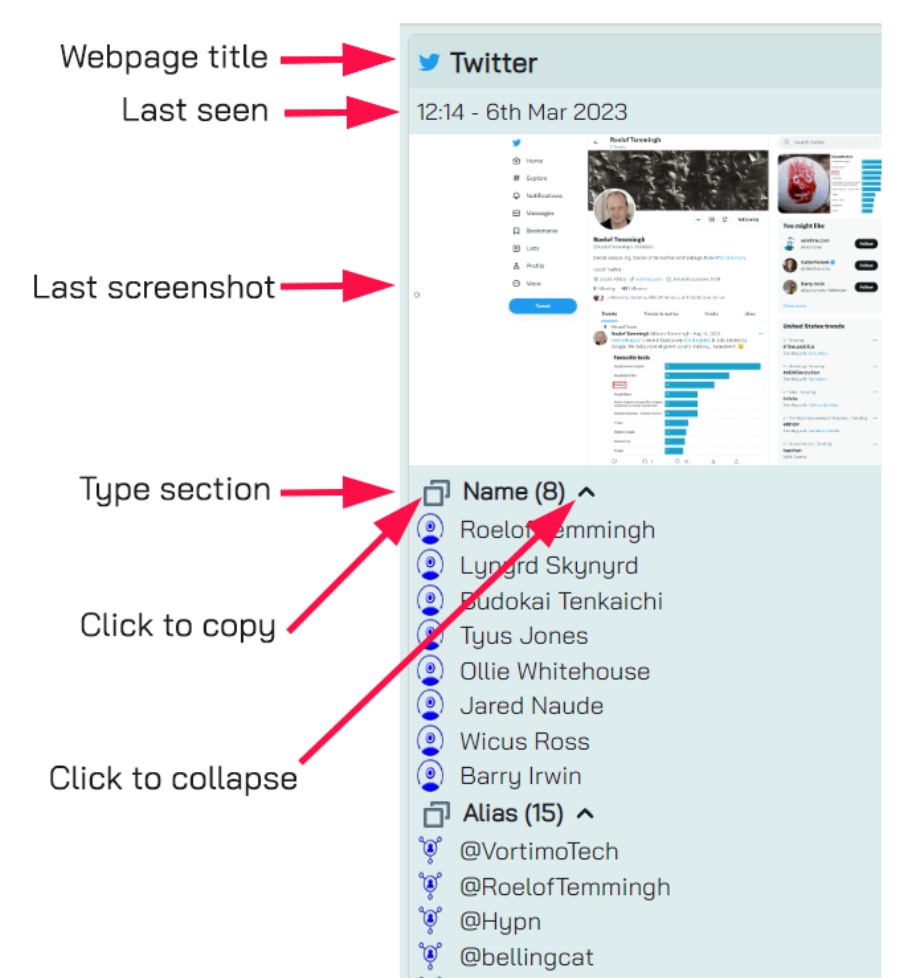
When a webpage / URL node is selected on the graph the view on right is updated to show the following items:
The title of the page. When you mouse-over this you get to see the URL too.
The date it was last seen
A list of objects extracted from the page. The list is arranged by type and each section can be copied to the clipboard or collapsed. When a type is collapsed it will show up as collapsed on subsequent webpages.
Object selected
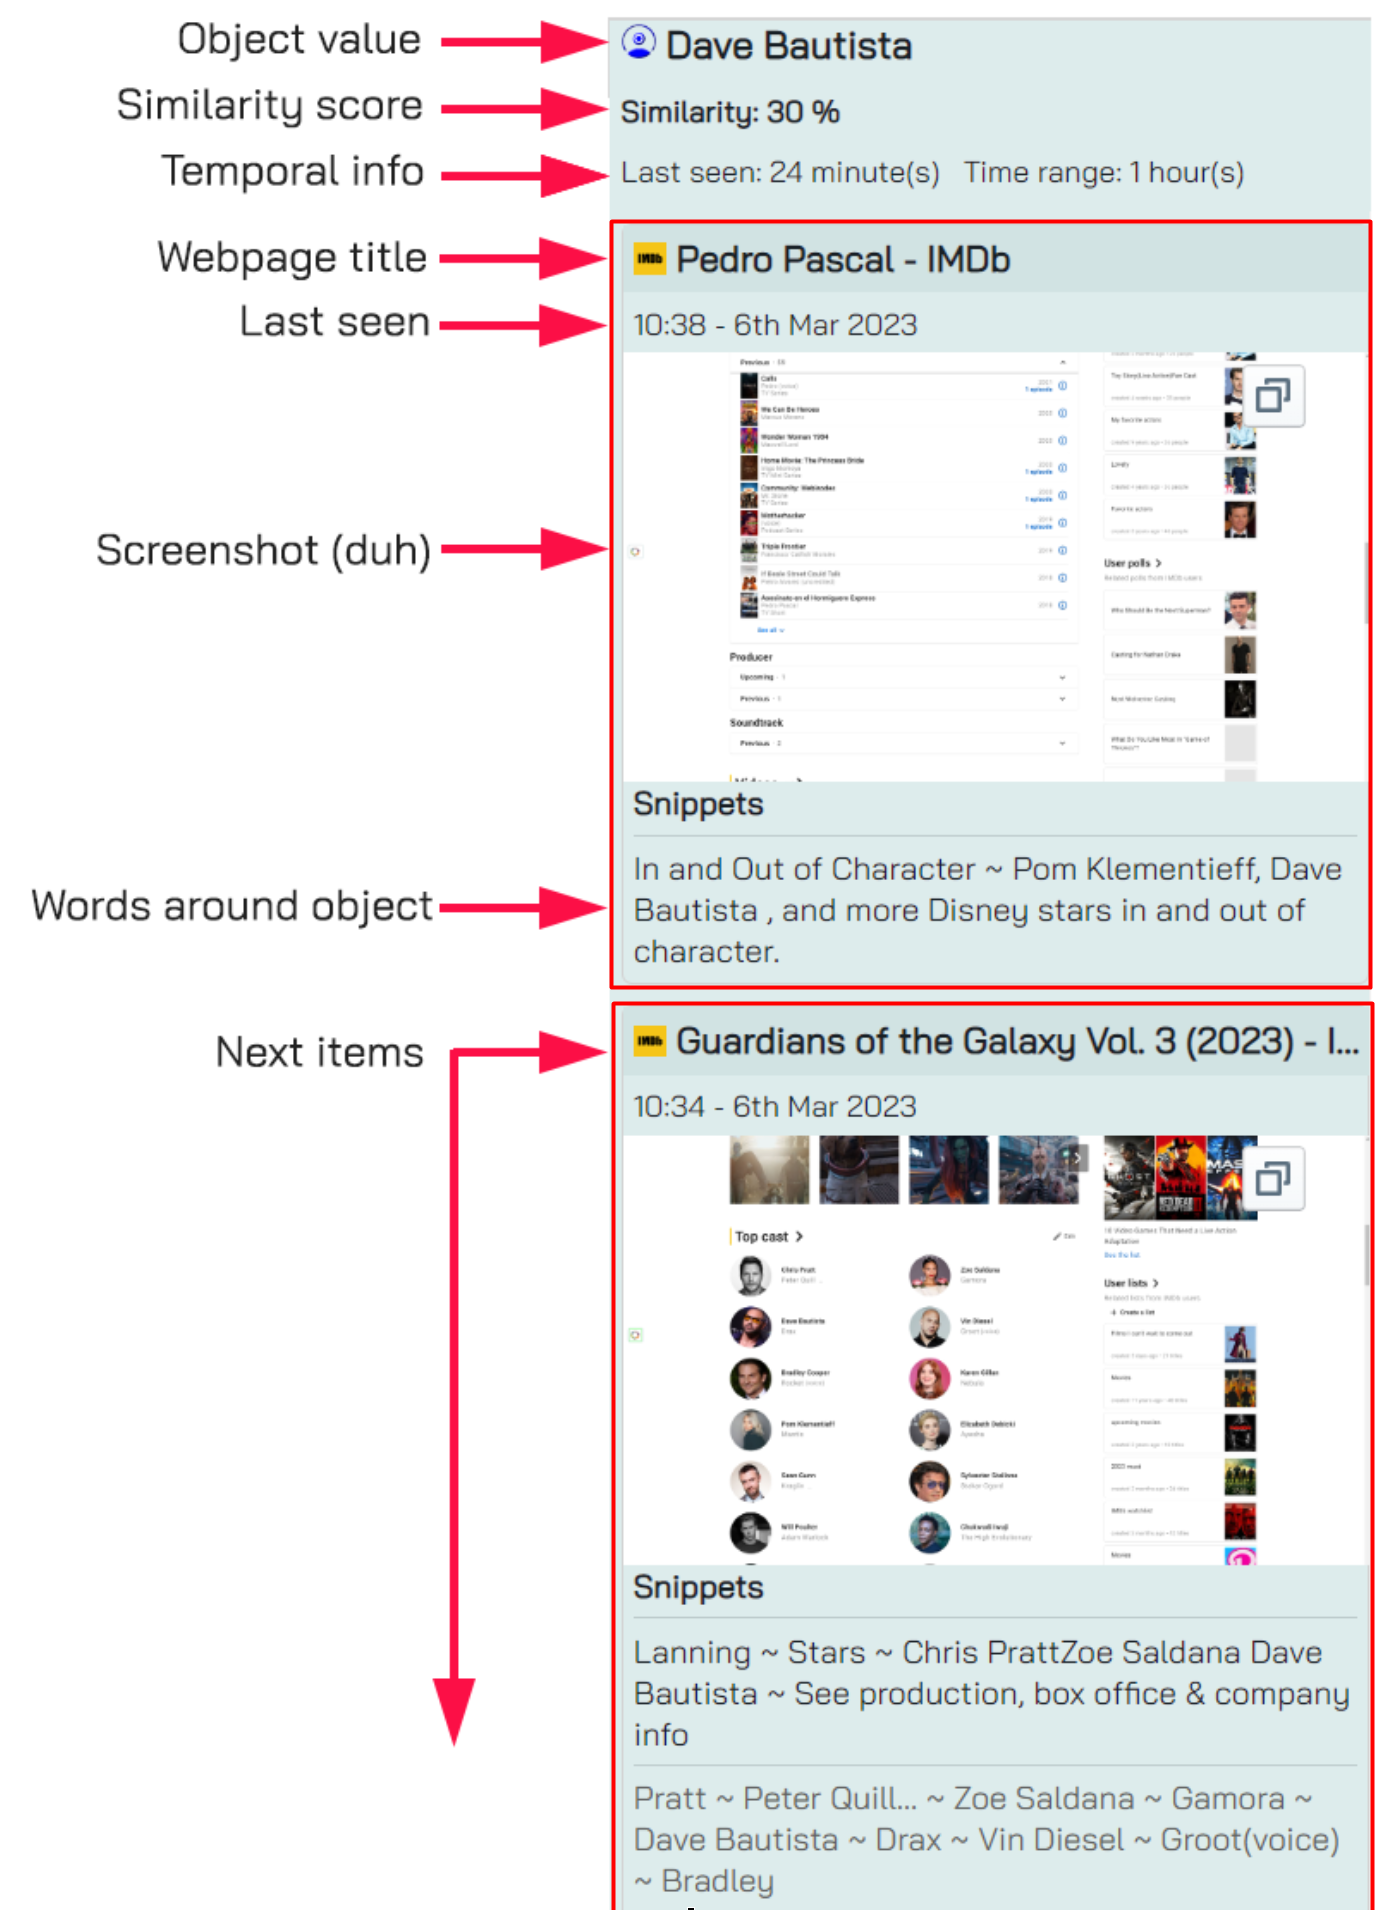
When selecting an object the right hand view looks a bit different. The following items are shown:
The only bit that you probably can’t figure out right now is the Similarity score. This is used in one of the graph modes, something that is explained in great detail later in this document. For now, just go with it.
Time range is the amount of time that elapsed since the first time you’ve visited a page that contained the object and the last time you’ve visited a page that contains the object. The ‘Last seen’ and ‘Time range’ indicators are pretty cool and useful when you’re working on a long investigation and you need to know if the object has been around for a long time or if you just seen it recently.
Selection and navigation
Selection works exactly the same as in the history graph. See the section on Selection in that document. If you came here first, uhmm… you should go there first.
The same really goes for navigation - it’s works in the same way as the history graph.
Filters
Filters help you to find the page or object you’re looking for or adjust the graph.
The interesting part about filters is that
they stack in function, meaning you can have multiple types of filters at the same time
they’re live - the UI updates immediately. The graph will change immediately.
Webpage/URL filters
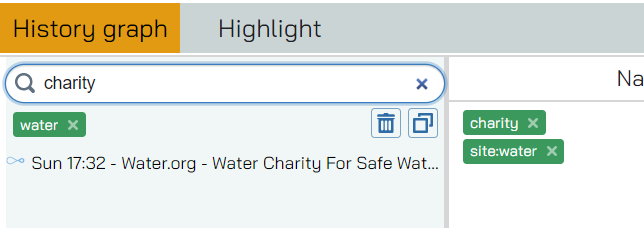
Exactly the same as you’re used in the navigation view - you can search for a word within the title of the site by just typing it in the textbox, or you can add the “site:” operator to search within the URL itself. As expected, to remove the filter you click on the X on right of it.
You can even stack these filters - when you’re done typing the tool will automatically load the filter - but you can only combine ‘site’ and titles:
Bookmarks and screenshots
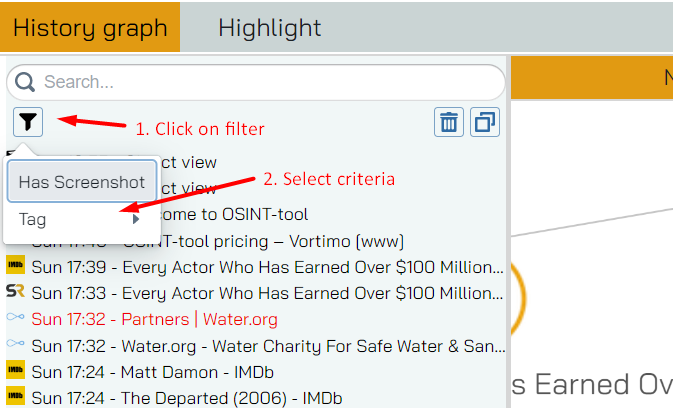
By now you should know that you can also filter by bookmark and by screenshot (e.g. if a screenshot was taken on the site). If you’re testing out this feature and you find it does not work - keep in mind that the filter only shows up if there are bookmarked / screenshotted sites. If there are none, the filter shows… nothing.
Object filters
Value
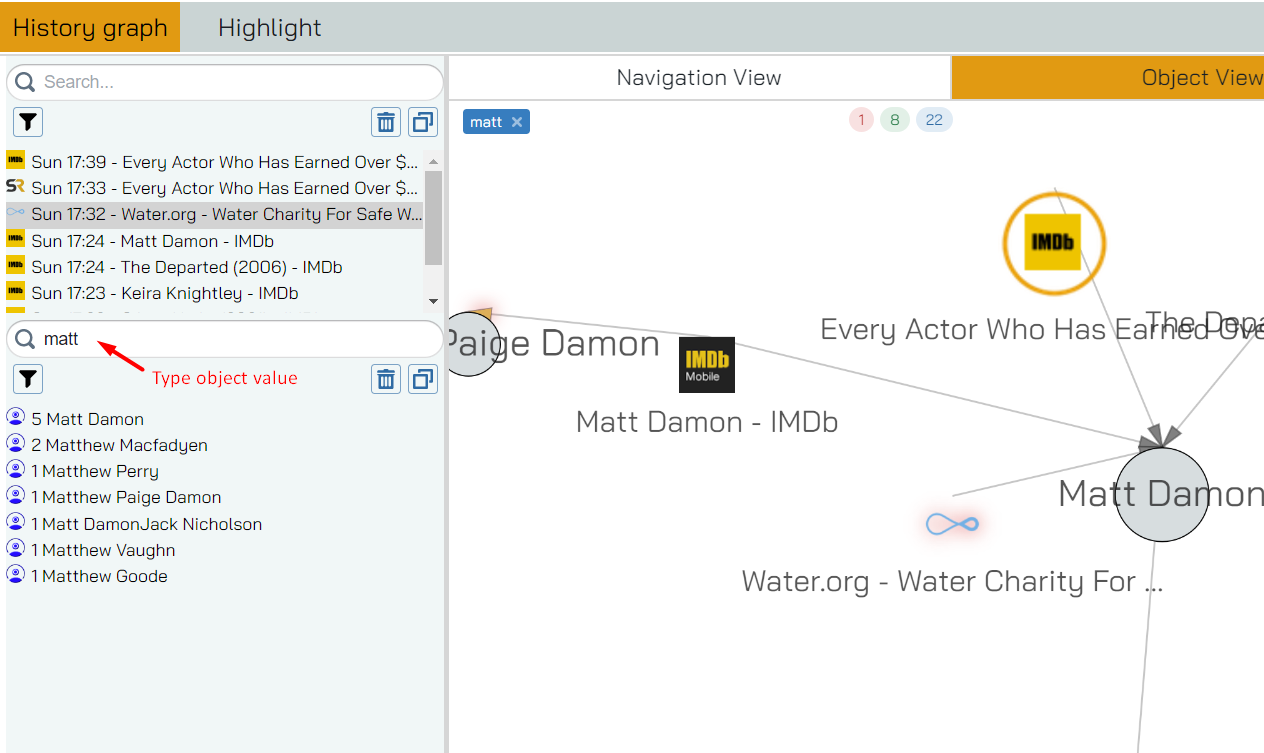
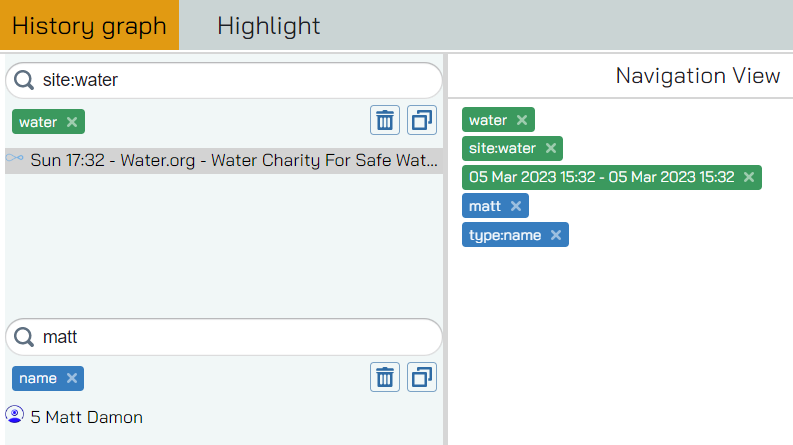
Filters available are the value of the object and the type of object. As expected, simply typing in a part of the object value you’re looking for will filter immediately:
In the maybe-a-bit-too-large screenshot above you’ll see that the object list has been updated after we’ve typed in ‘matt’ to show all object that contains that value. The webpage panel also updates to only show pages where that word was found on - and the graph updates too.
Type
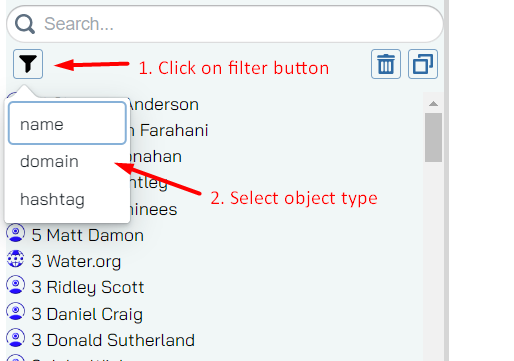
You can also filter by type, by click on the filter button and selecting which type to filter by. Of course, we’re only showing you types that you have in your data.
Again keep in mind that all of these filter stack and that they have immediate effect on every component of the UI. Here is an (absolute overkill) example of all filters being used:
Graph modes
Perhaps a little less intuitive are graph modes. As such we will spend a little more time on this subject. Graph modes hides and shows nodes based on how they are connected and how they compare to each other. This might sound very hand-wavey right now, but when you revisit this paragraph afterwards you’ll see that it’s factually correct.
By default, the graph is in what we call “magic mode” or auto mode. In auto mode the computer determine what should show up in the graph and what should be omitted. It does so using a few criteria:
<magic mode criteria>
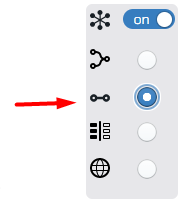
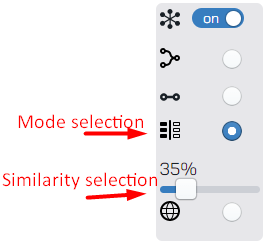
You can however set the graph mode yourself. To get to it, in object mode - click on the graph mode button on the top right hand of the graph:
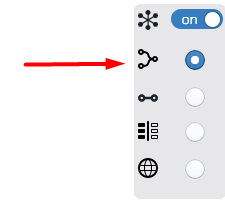
When you click here you’ll see the following options:
Let’s discuss these in more detail.
No leaf
In this mode all leaf nodes are removed. WTF is a leaf node you ask. A leaf node is a node with only one parent. For our purposes that means that it is an object that only appears on one webpage.
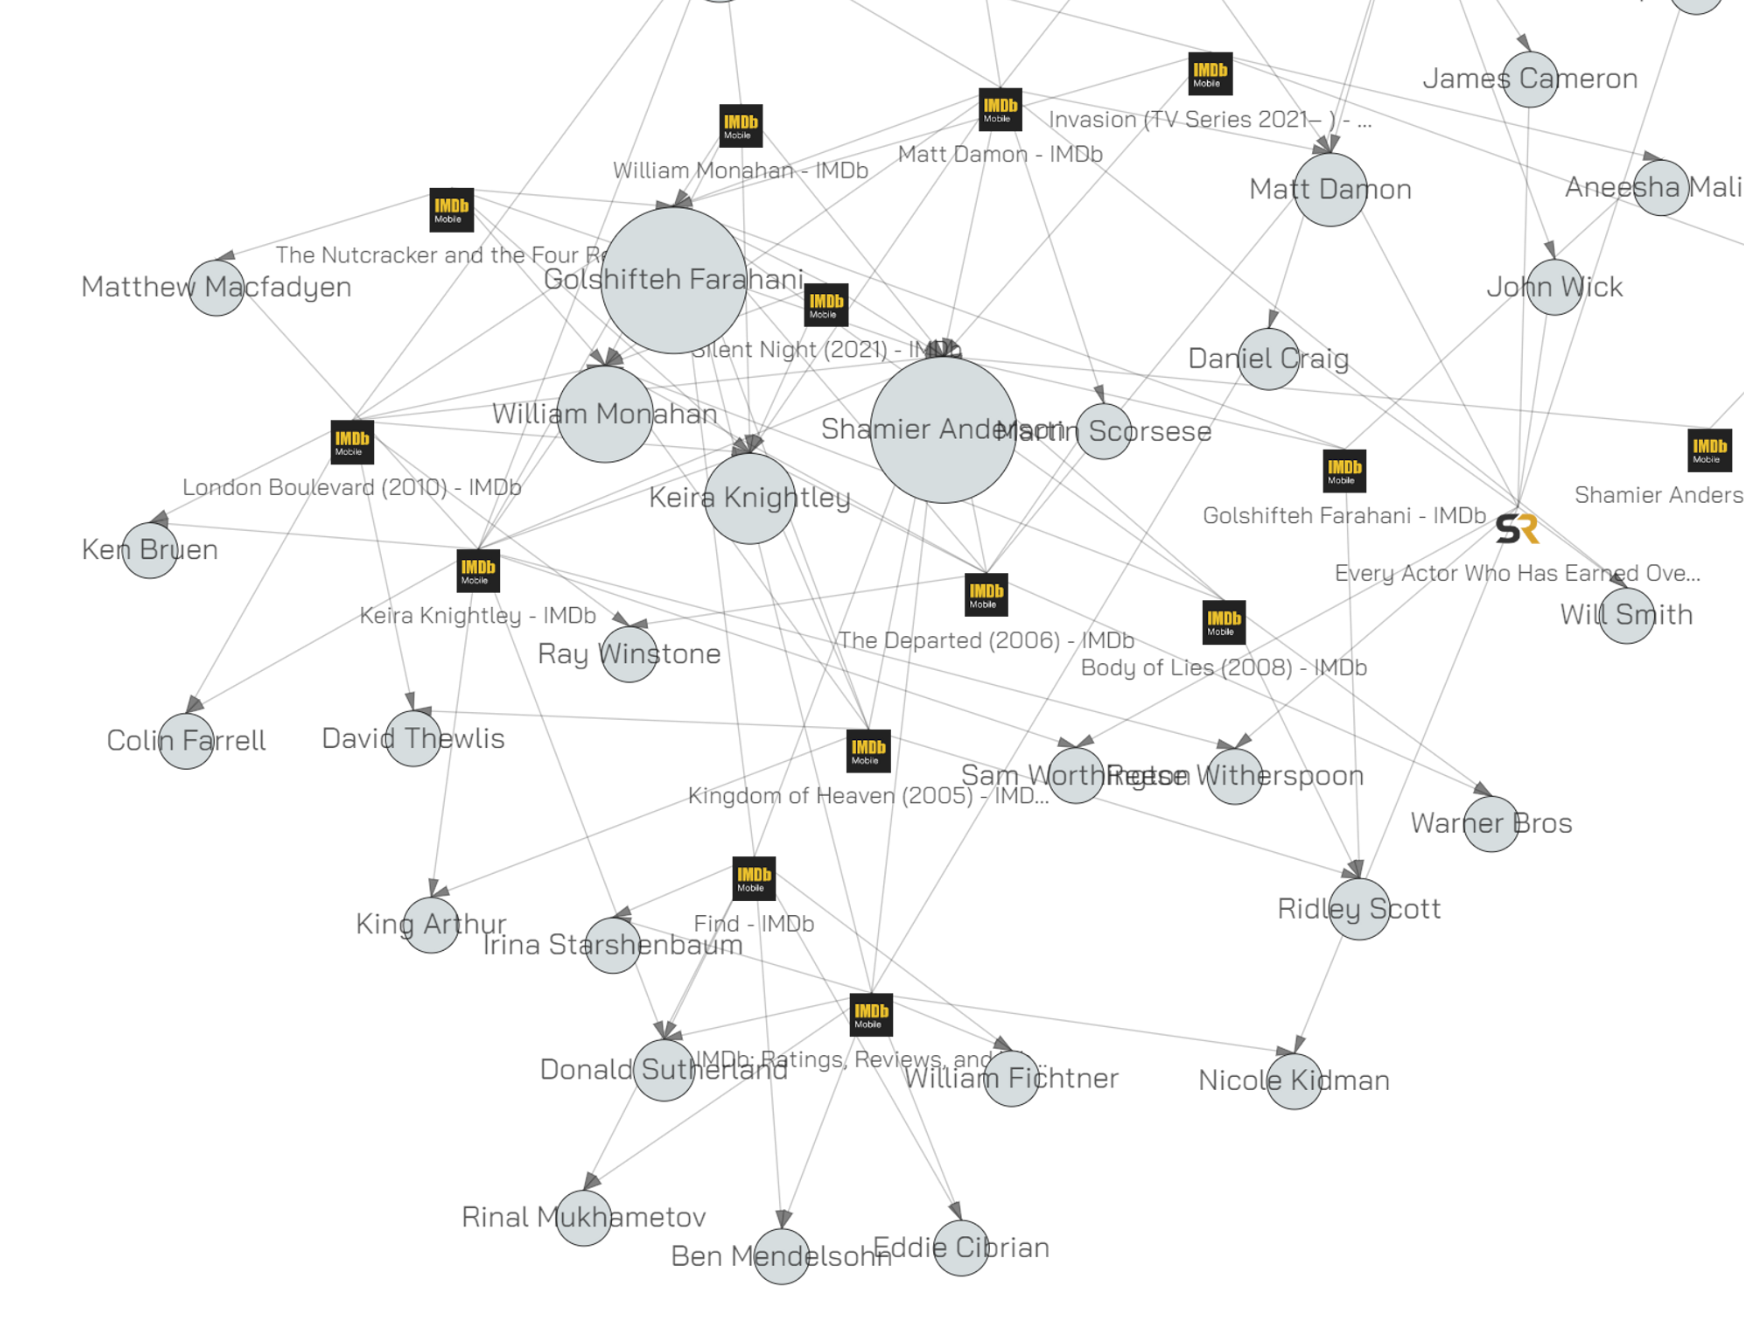
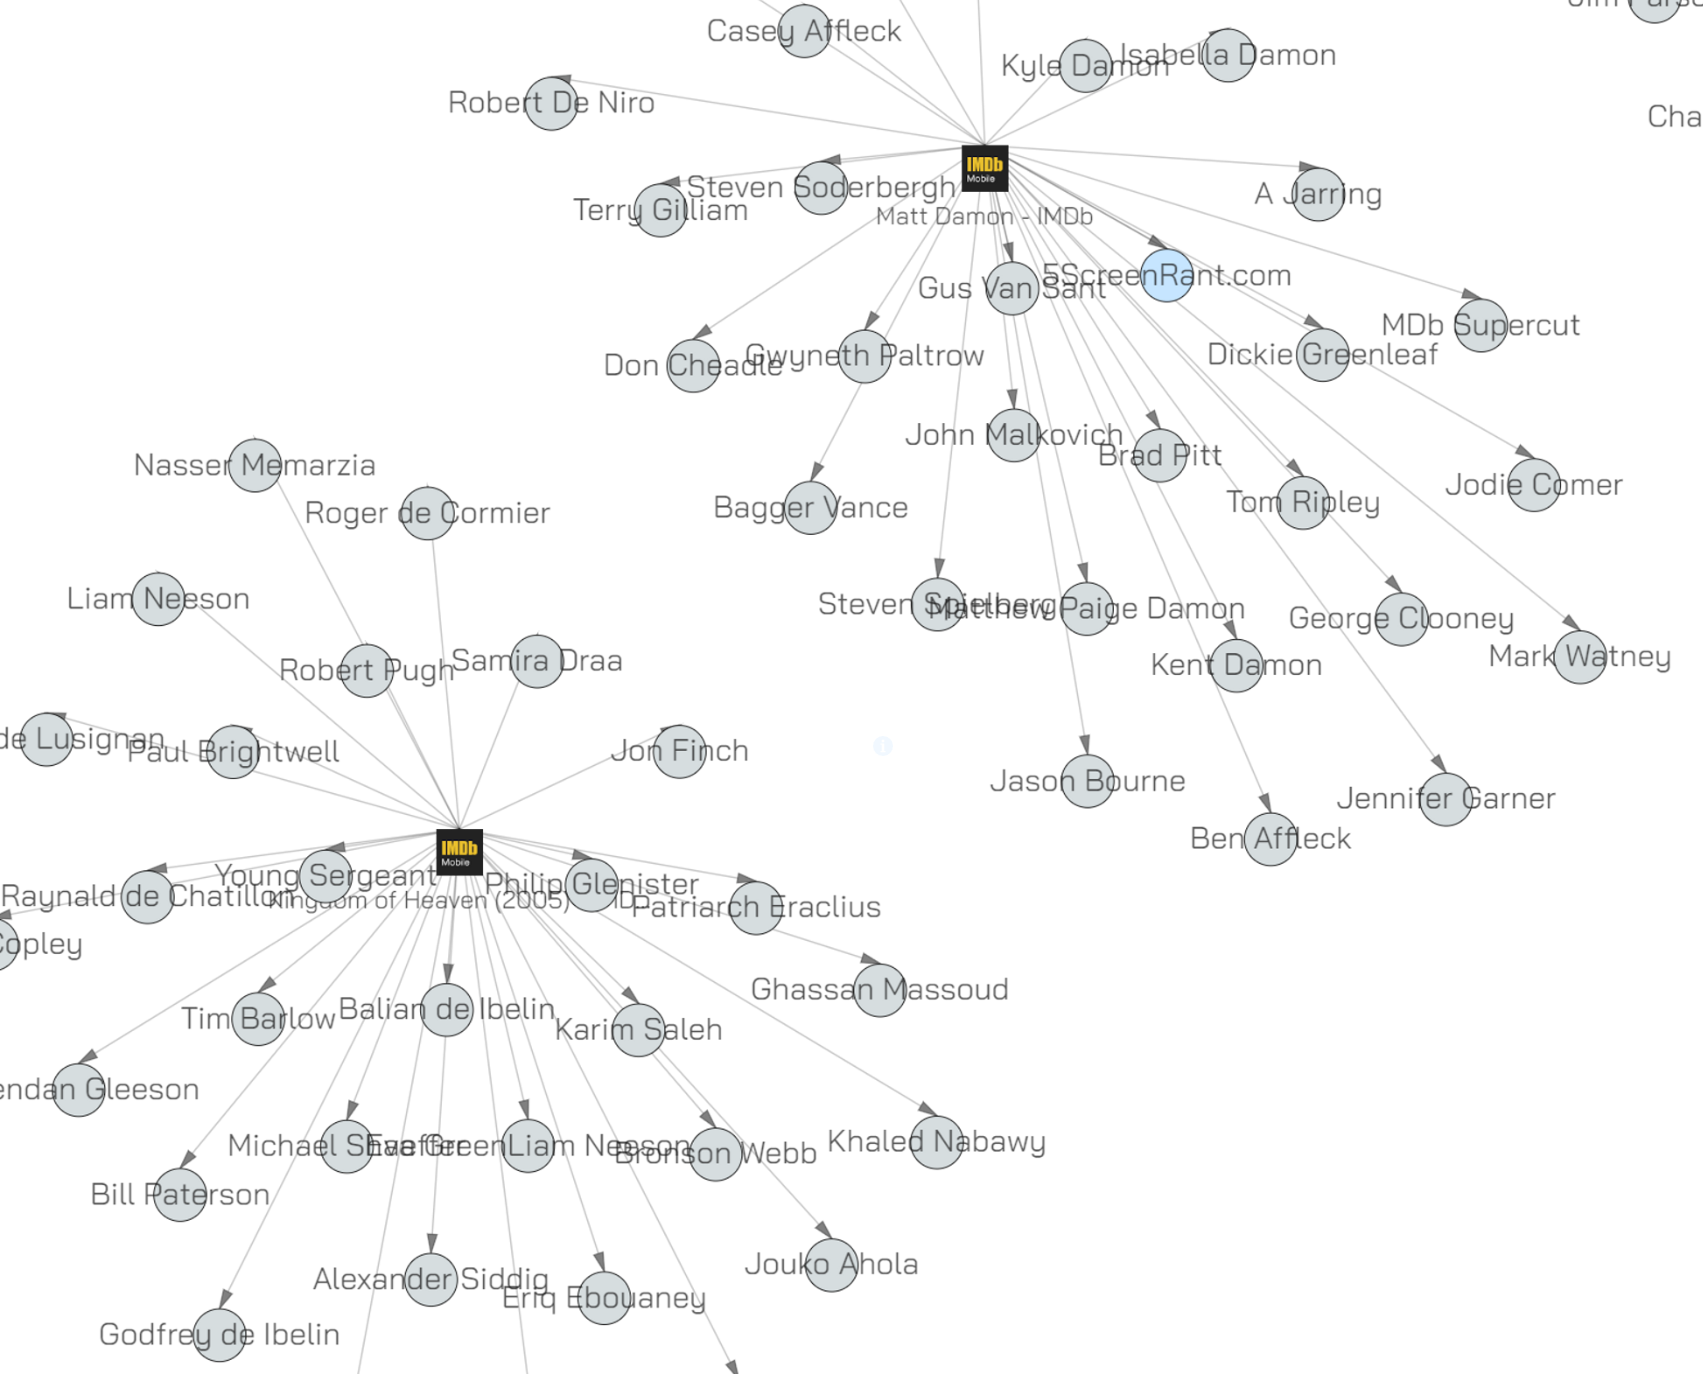
Here is a graph with no leaf nodes:
You can see that none of the object have one incoming link / one parent. This mode is what you use when you’re looking for common objects across multiple webpages. In this particular graph (where we were browsing a few films on the IMDB) it means we’re looking at people credited in more than one film.
Only leaf
The inverse of the previous mode. It shows ONLY leaf nodes. The same graph, in only leaf mode looks like this:
You can see that all the objects (mostly names) only has one parent. Why is this interesting? Well, consider browsing a lot of pages on the same social network. You might want to look at people that only appear once in the feed. In the case of this graph, it shows people that are only credited in one film, people that are uniquely found on one page.
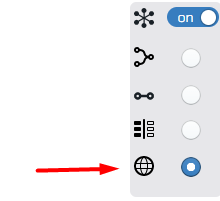
Domain mode
In this mode (yes we skipped the other one for now) objects are only shown when they appear on websites with different domains. Be sure to know what a domain is. A domain is not a DNS name and a domain is not a website and a domain is not an URL. A domain has an NS record and a domain has whois information. A domain is the google.com part in https://www.google.com/search?q=what+is+a+domain.
If you’re unsure what a domain is, please do not ask us ever. This is a pet hate subject for us. The world is divided between those that know what a domain is and those that are unsure if a domain can also be a DNS name.
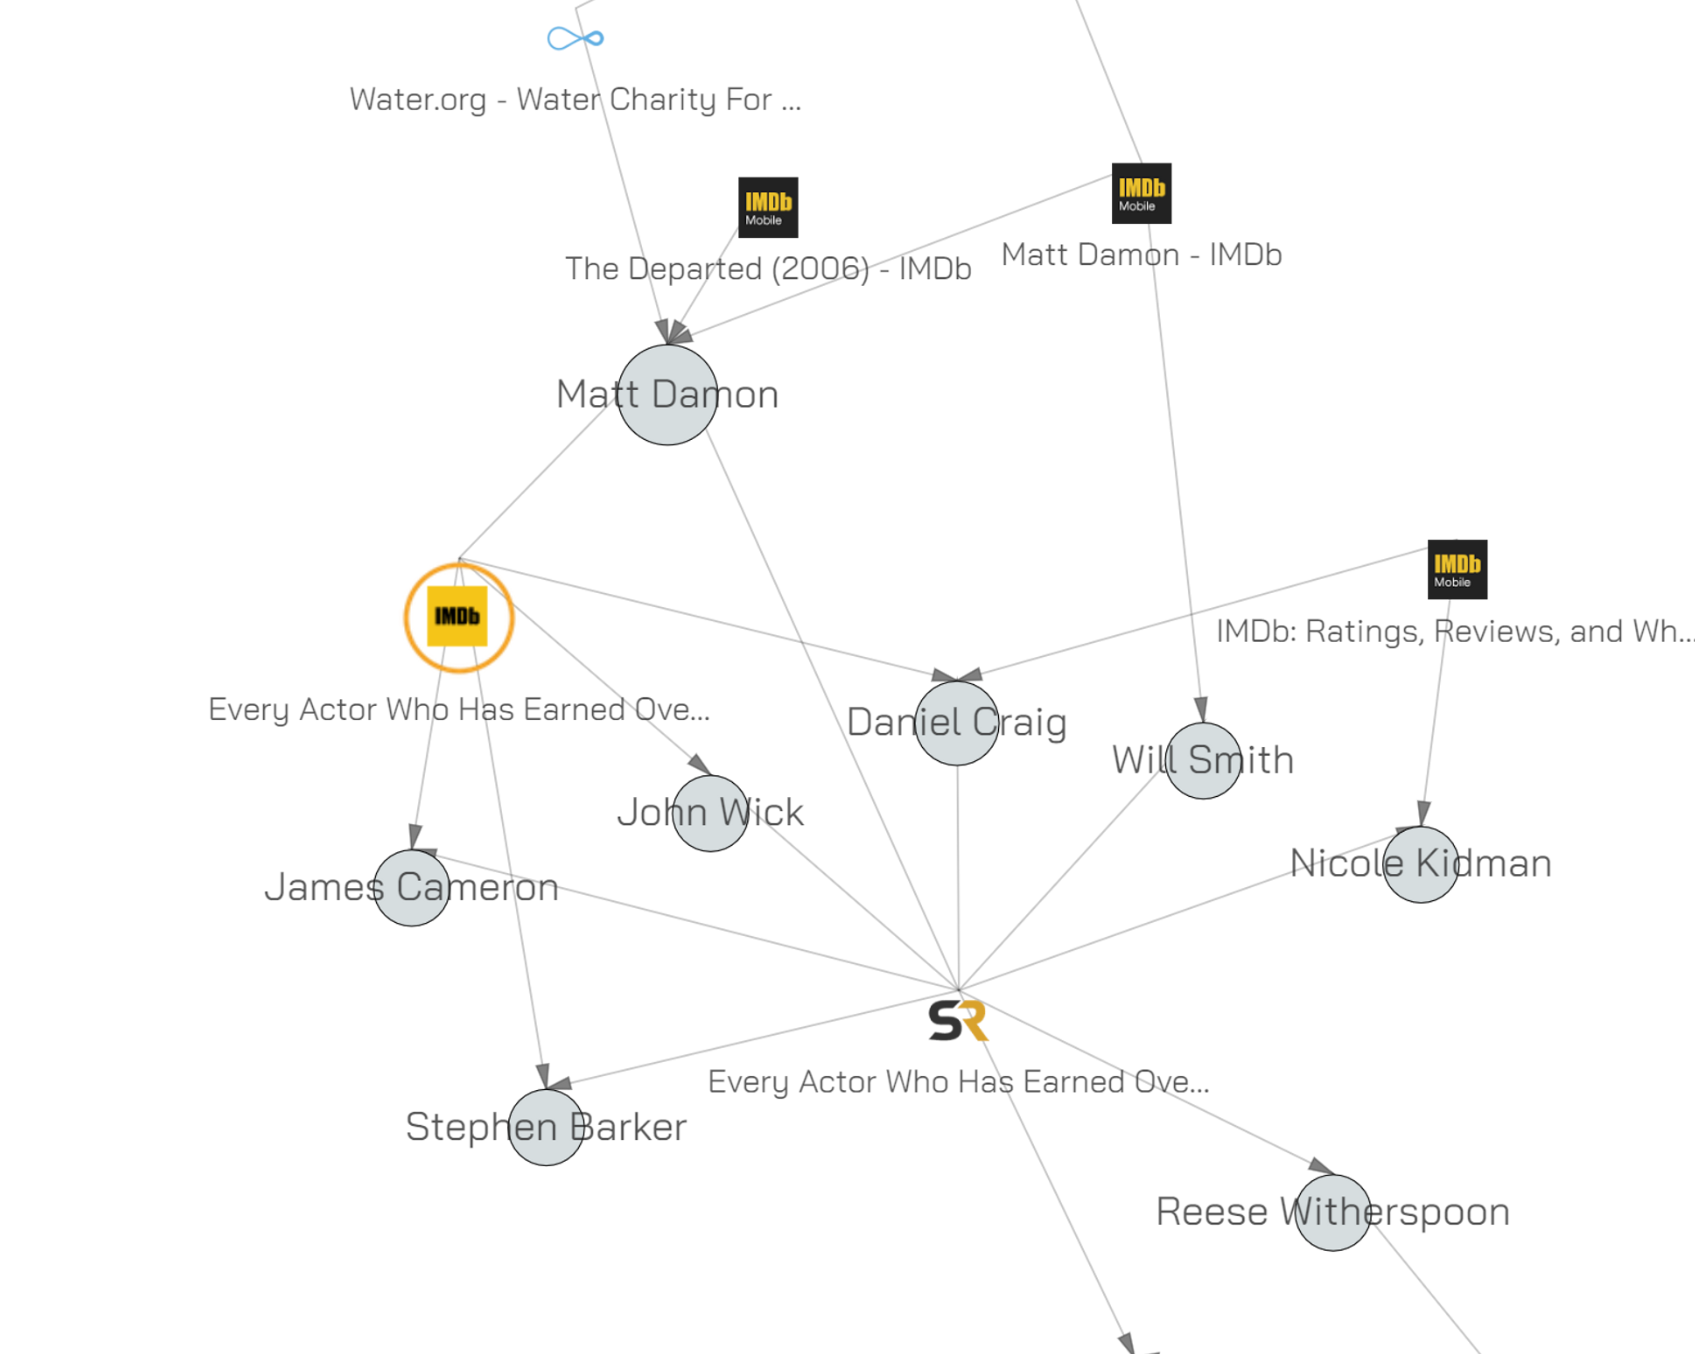
Let’s look at the graph in domain mode:
We now see names that appear on different domains. Daniel Craig appears in the graph because his name is on imdb.com and on screenrant.com. Matt Damon’s name is there because he is on water.org and on imdb.com.
This mode is very useful when tracking objects across many sites in a large investigation. It’s the mode to see which things show up all the time.
Similarity mode
We left this one for last because it’s the most complex mode (but so satisfying when you get it!). In this mode we only show objects that are similar but not exactly the same. What does that even mean?! To answer this perhaps we should start by explaining the problem this mode is solving.
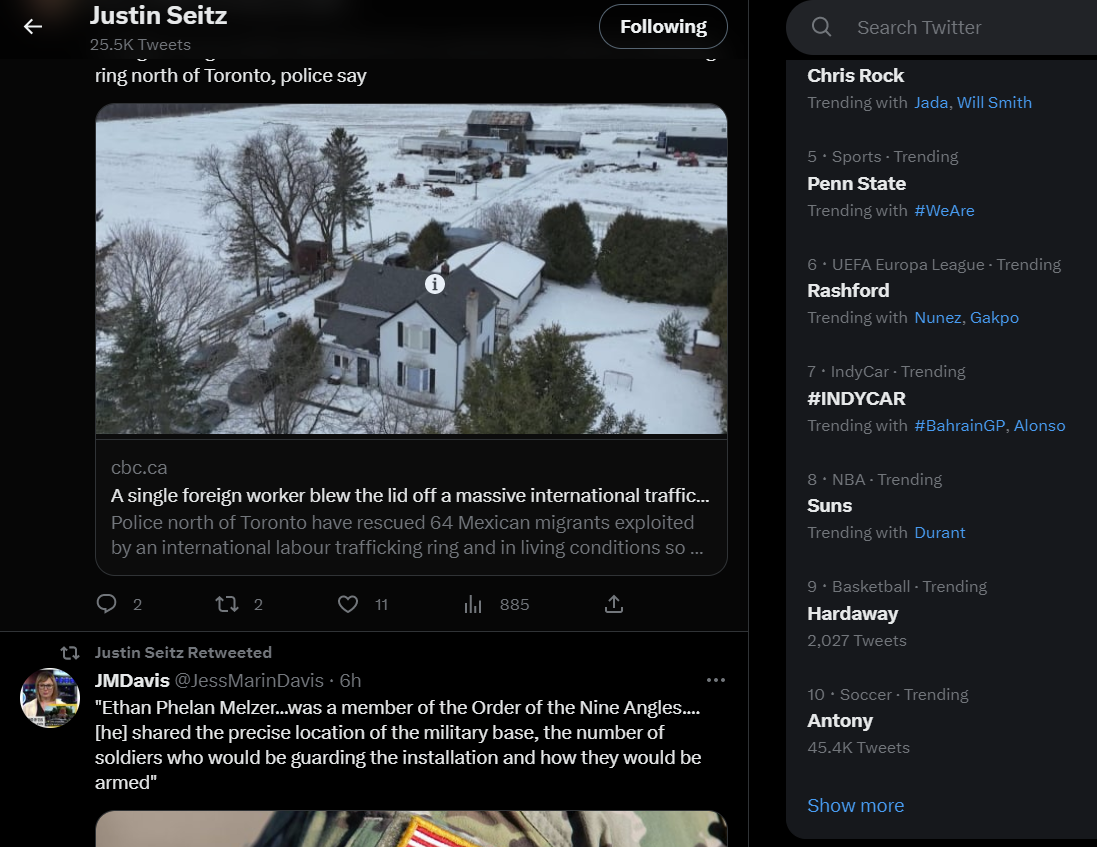
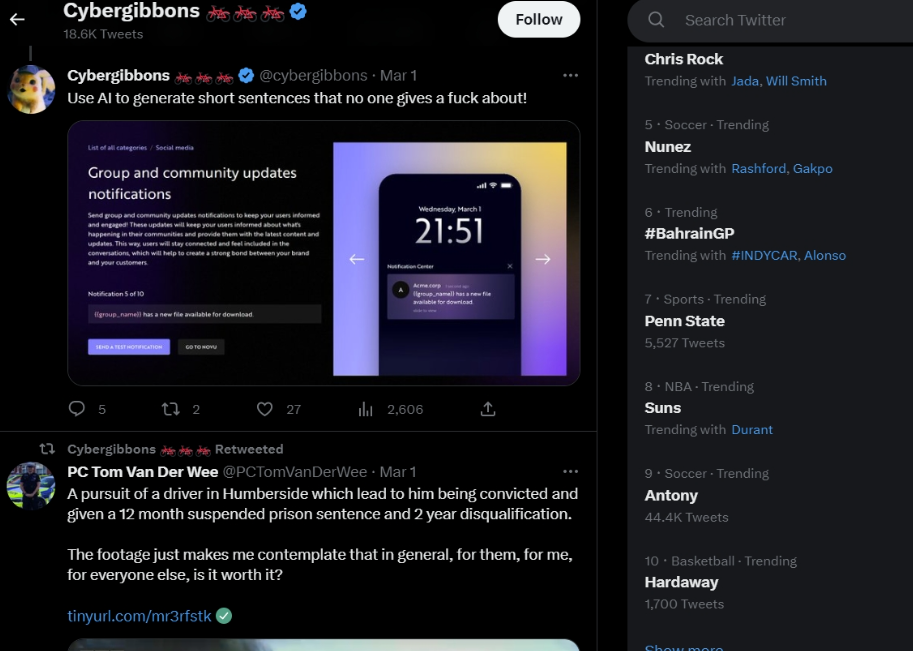
We know that the extension is 100% site agnostic. It does not know it’s on Twitter or Facebook or Instagram or… whatever. It just does the same thing for every site is sees - it extracts the objects on the page. With that in mind consider the following two Twitter pages:
Can you spot the problem?
The problem is on the right - the part of Twitter that is showing trending topics. It’s VERY similar for both pages. So in ‘no leaf mode’ this is what these two pages look like on a graph:
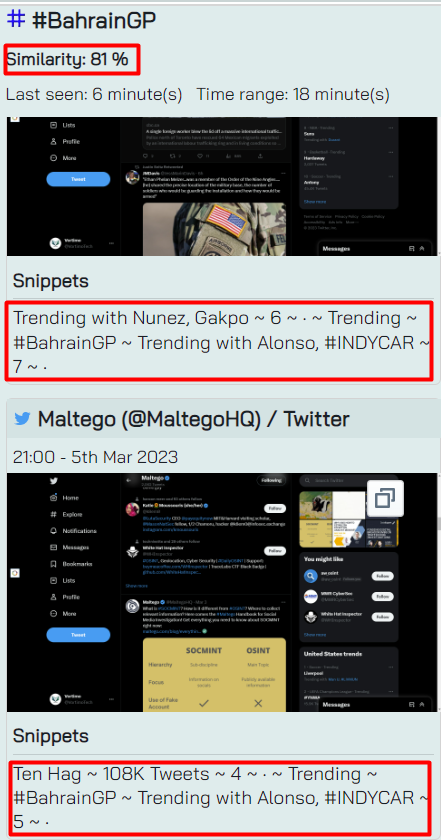
But - we’re not really interested in the BahrainGP or #YNWA or Will Smith (I mean no offense we love F1 and Men in Black but… not right now OK). So - in the similar mode we look at the words around the object and see how similar it is to the words around the object on the other page. This similarity is calculated as number - a percentage of sameness. The higher the number, the more the object’s surroundings appear to be the same.
This number is actually shown on the right side when you select an object, together with the words around the object - we call it the snippets.
You can see that in the case of #BahrainGP the “snippets” - the words around the object - is very similar. 81% similar.
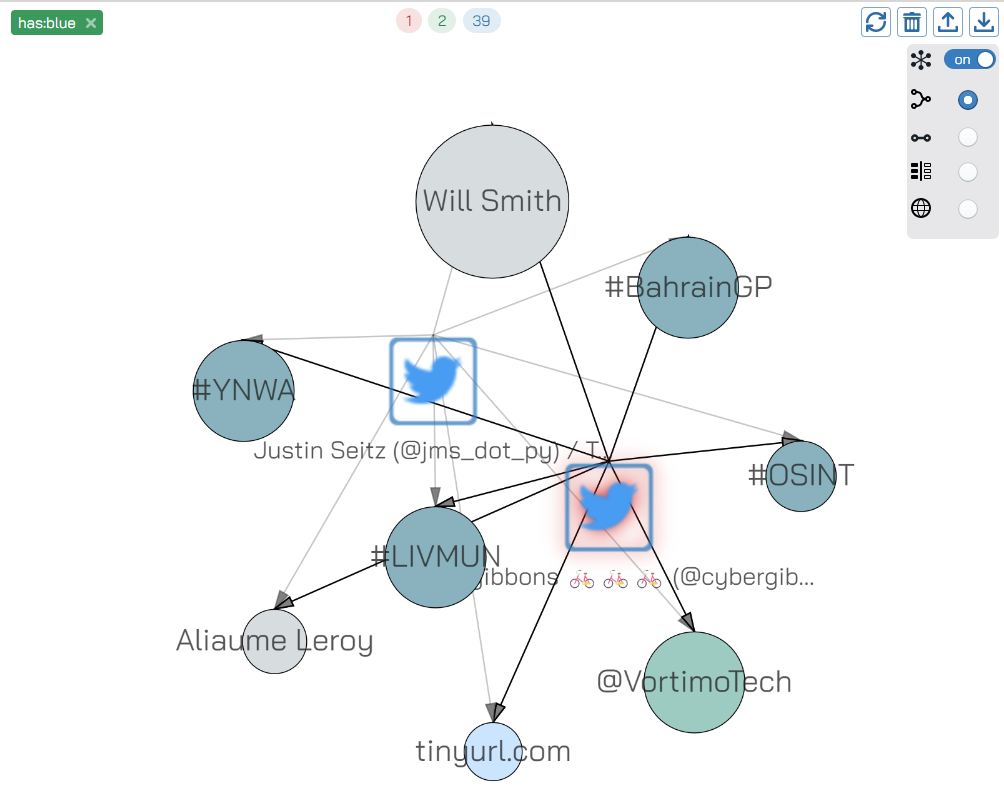
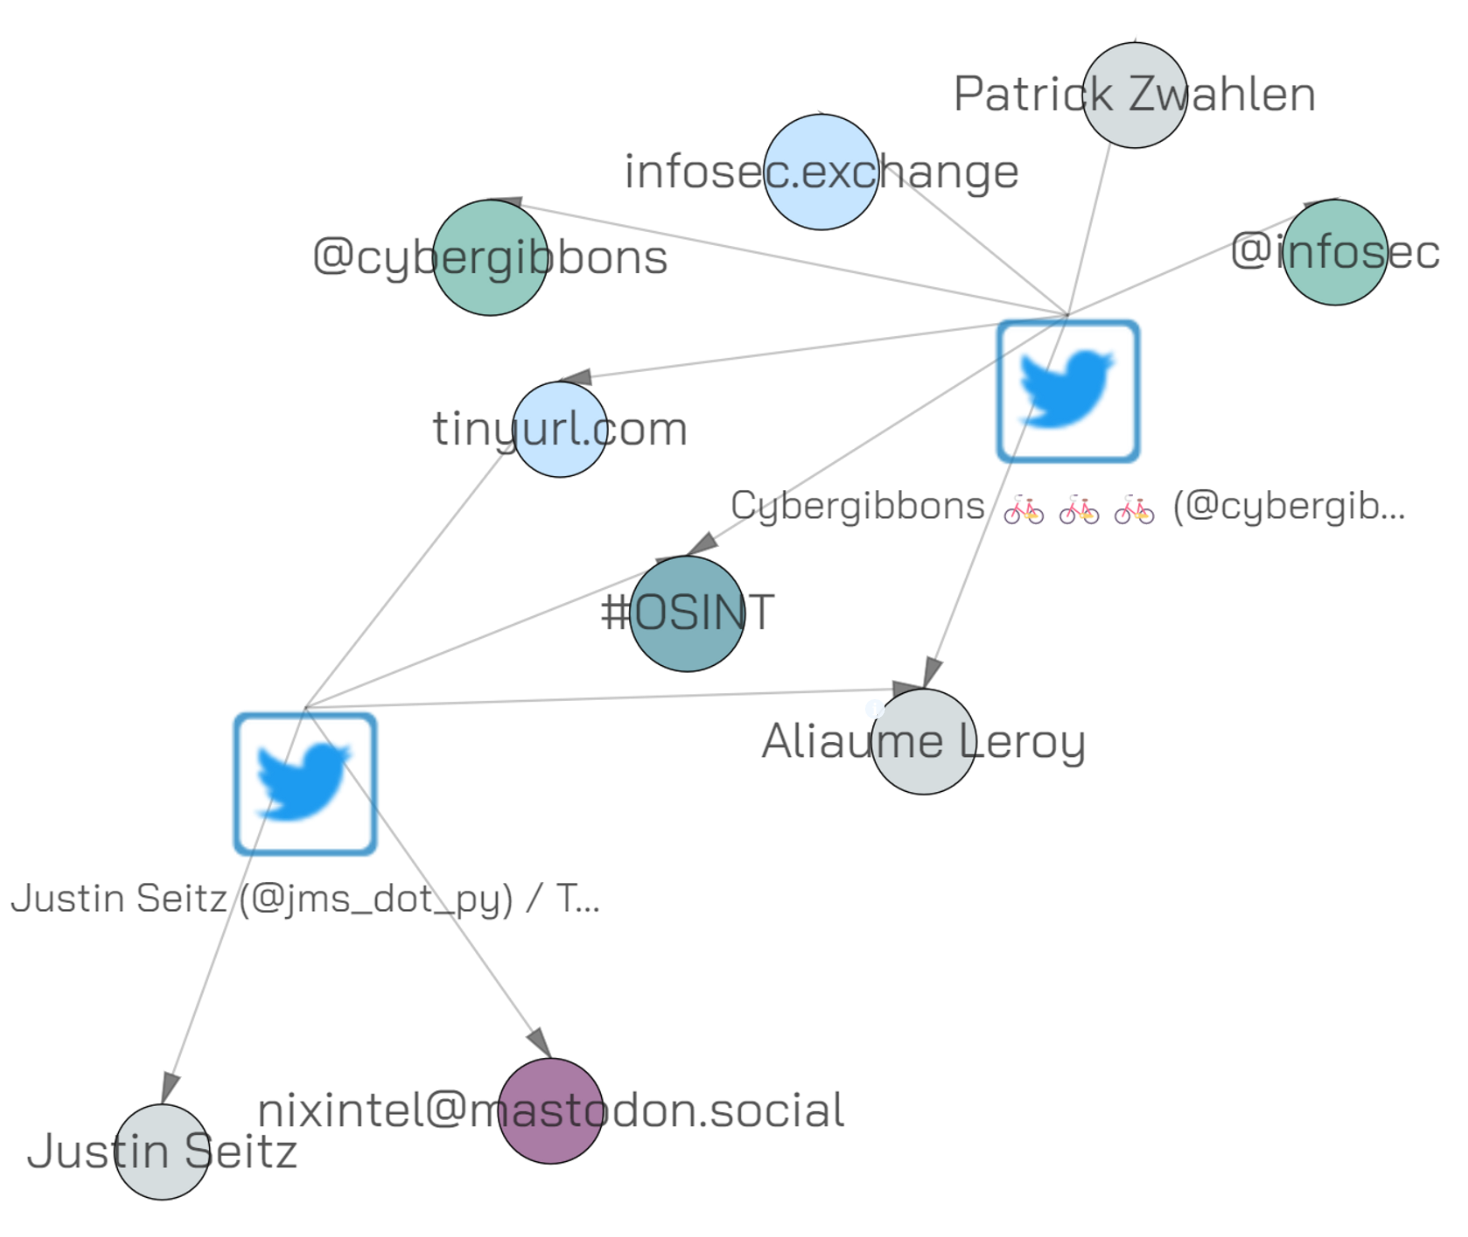
When we (finally) thus enter similar mode we see a slider appear. By default the value is %35, meaning that we will only show objects that appears that have less than 35% similarity in the words surrounding it. With the slider on 35% the graph looks like this:
This looks a lot better! But wait, why are there extra nodes (”Justin Seitz”, “Patrick Zwhahlen” and so on)? This is because the words around the object is compared with EVERY node of the graph and those nodes are 1) under the threshold 2) connected to our blue nodes (we filtered by blue bookmarks).
This mode is useful for obvious reasons. When you are browsing pages that have the same content littered on it in ads or trends you don’t want it showing up in your graph. This mode prevents it.
Object actions
These are actions you can perform on an object - the actions are shown in the menu when you select and right click on an object node.
The actions on webpages will be covered afterwards.
Removing nodes you don’t want/like
You can remove nodes in two ways - deleting them or ignoring them. Deleting a node seems to be great plan - but keep in mind that the next time the object is seen it will re-appear on the graph. Ignoring is actually a better option in the long term. But, it’s your choice.
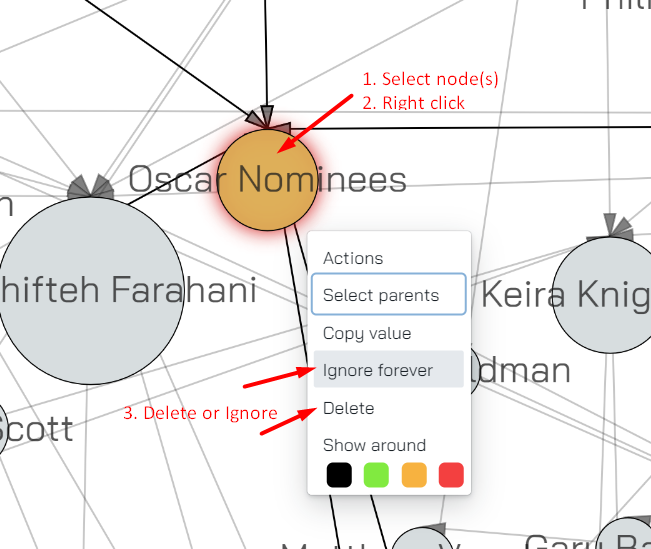
To delete or ignore nodes - select them and right click. In the menu select delete or ignore forever:
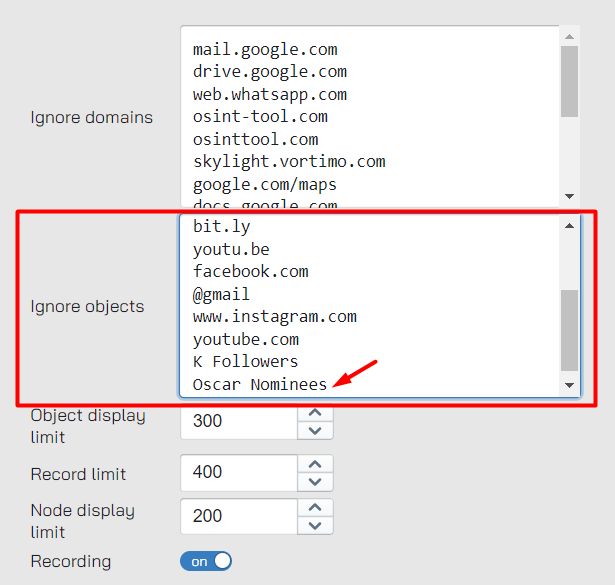
Ignored values are actually placed in a list. You can access this list in the graph settings. The list survives starting a new graph or loading from disk.
As you can see, the list comes predefined with some items we know you’d want there.
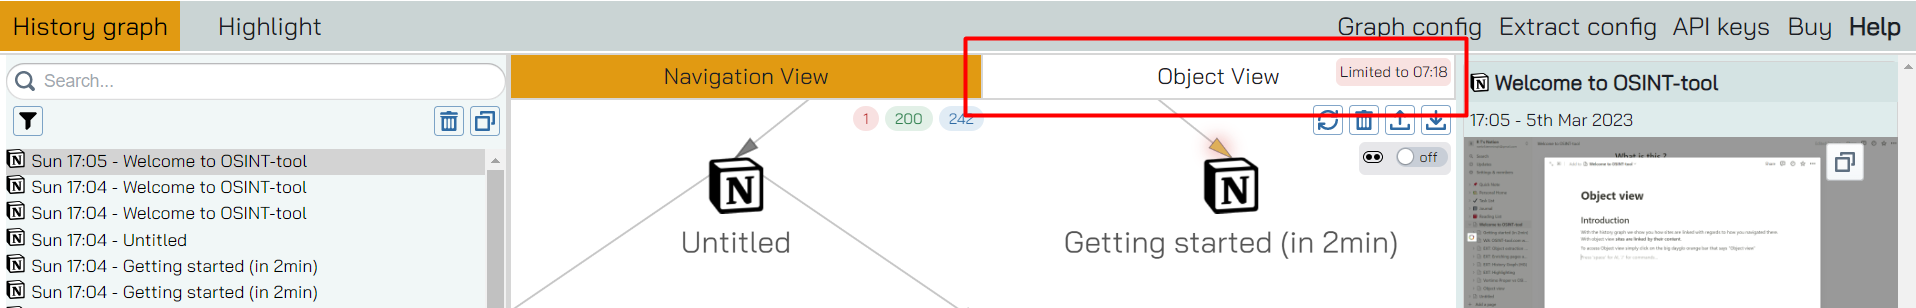
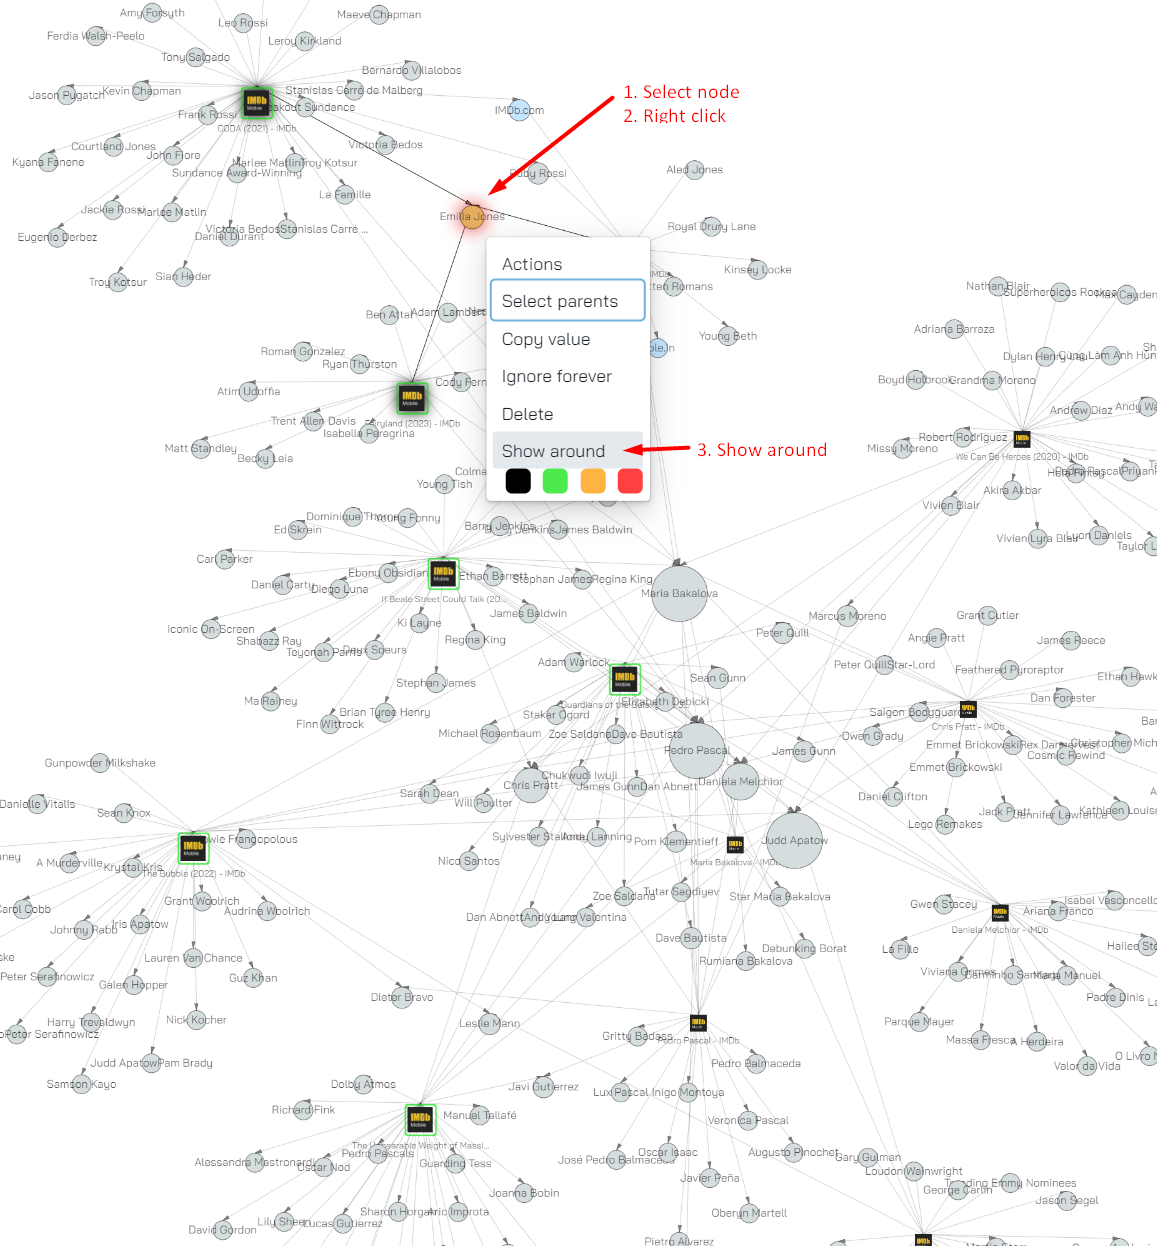
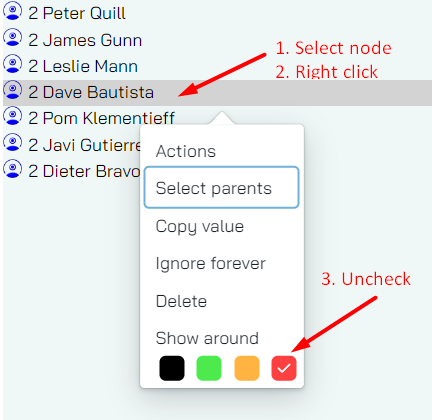
Show around
With this action we show you the node’s siblings - the node’s parent’s children; all other nodes are filtered/hidden. This is useful when you want to isolate part of the graph so that it only shows you objects that’s fairly closely related to the object you’ve selected.
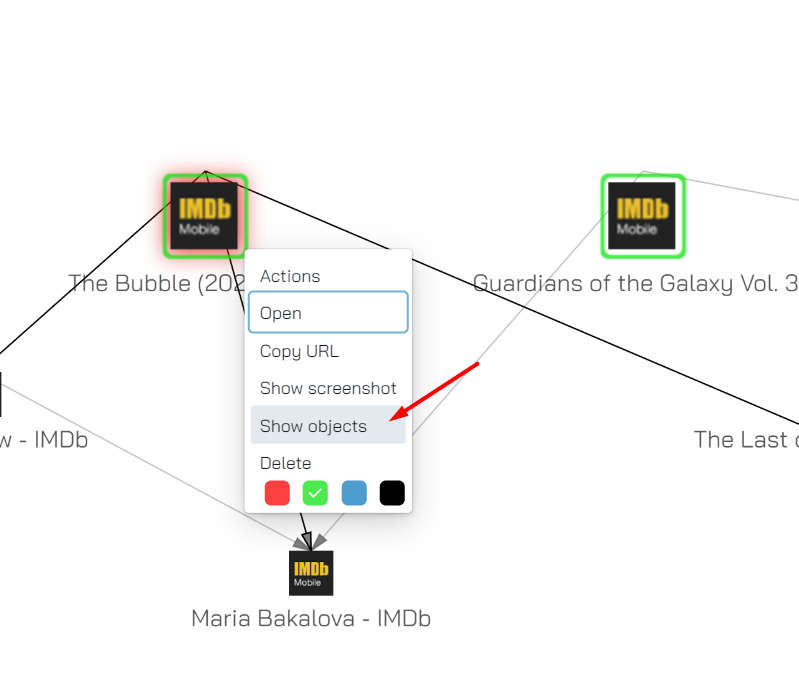
As an example, consider this node:
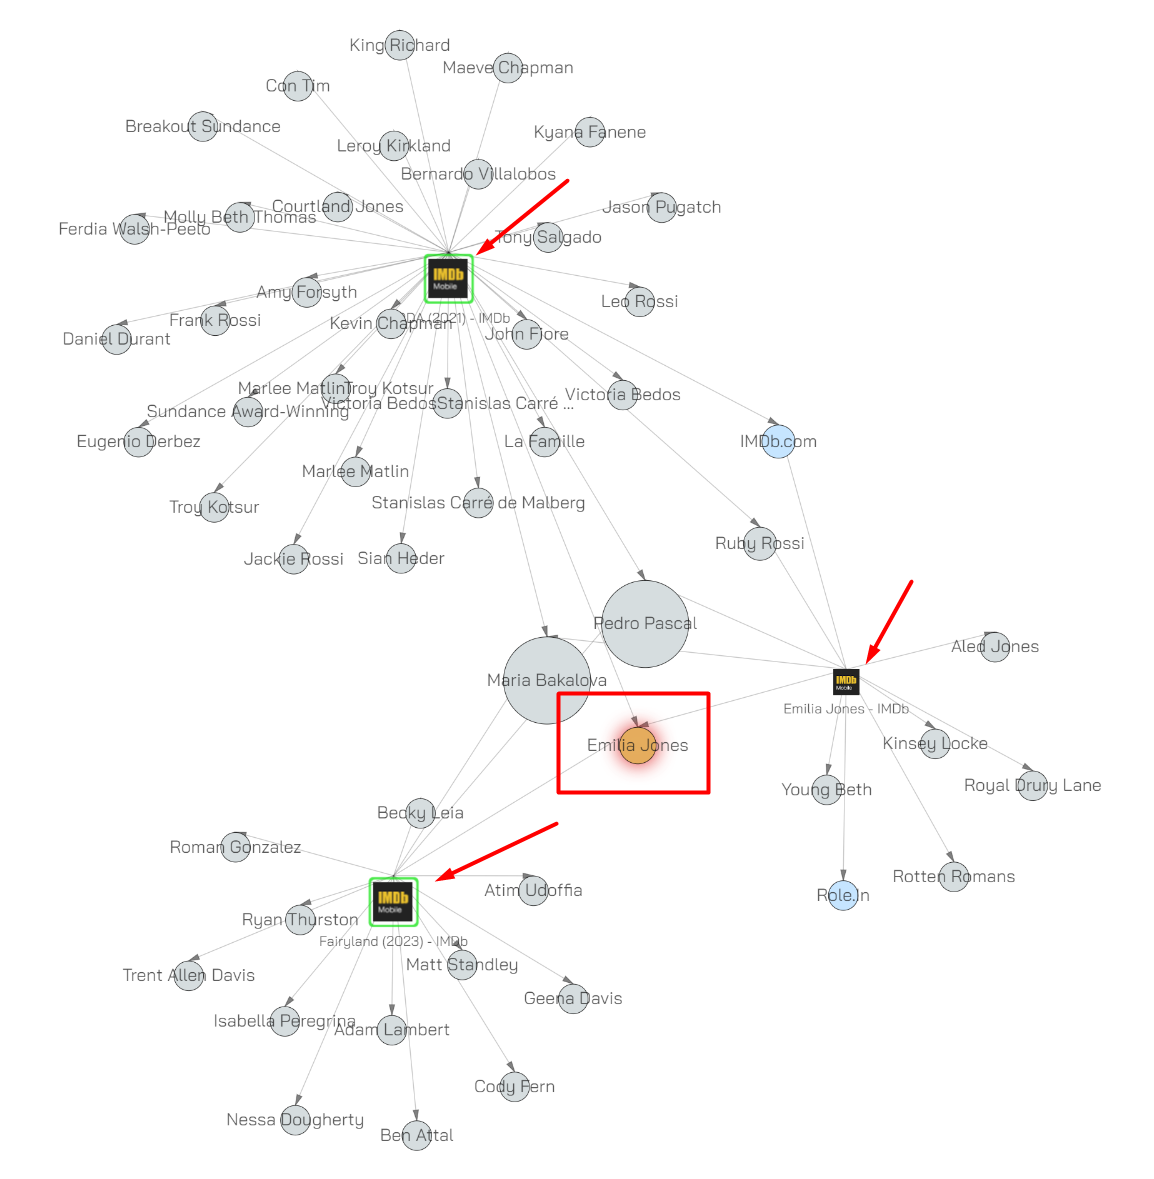
The resultant graph looks like so:
You can clearly see the parent nodes marked with red arrows and the selected node in the red box.
This feature allows us to quickly isolate an object in a large and busy graph and only show us the relevant objects around it.
Copy value
Why do we even have documentation about this feature? It does exactly that - it copies the value of the node to your clipboard. If you have multiple nodes selected it makes pretty list too.
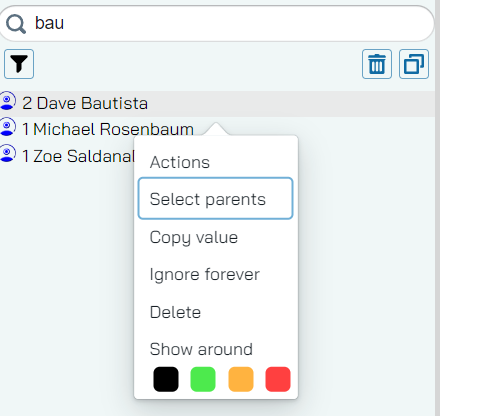
Select parents
This feature selects the parents of a node - this is useful when you are doing house keeping - in other words, deleting nodes from a graph.
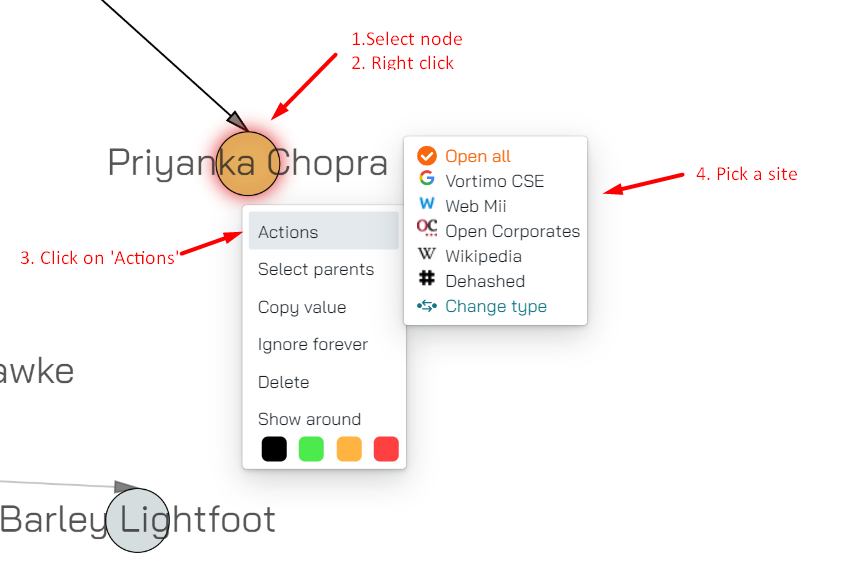
Actions
The very ambiguous action ‘Actions’ brings up the Link section of the website find.OSINT-tool.com. Of course, these links are specific to the type of object. In the example below it’s what’s available on the Name object:
Highlight control
You can easily add items into the highlight list - see Highlighting section for more information on what this really is. You might expect that we show which objects are in the highlight list but alas we don’t (yet). If enough people buy licenses we will do just that.
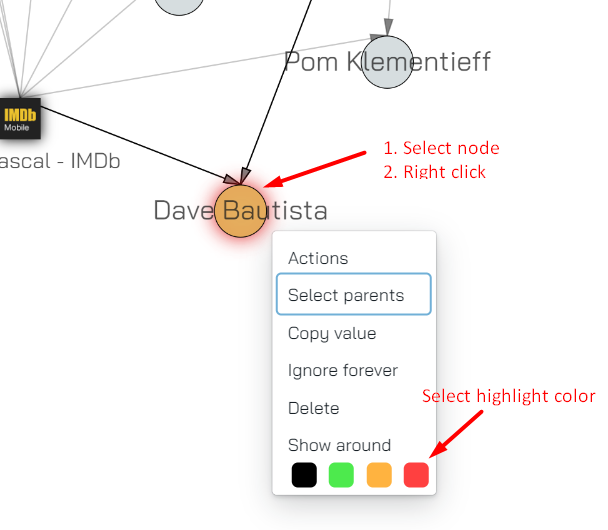
For now you can add and remove items into the highlight list as follows:
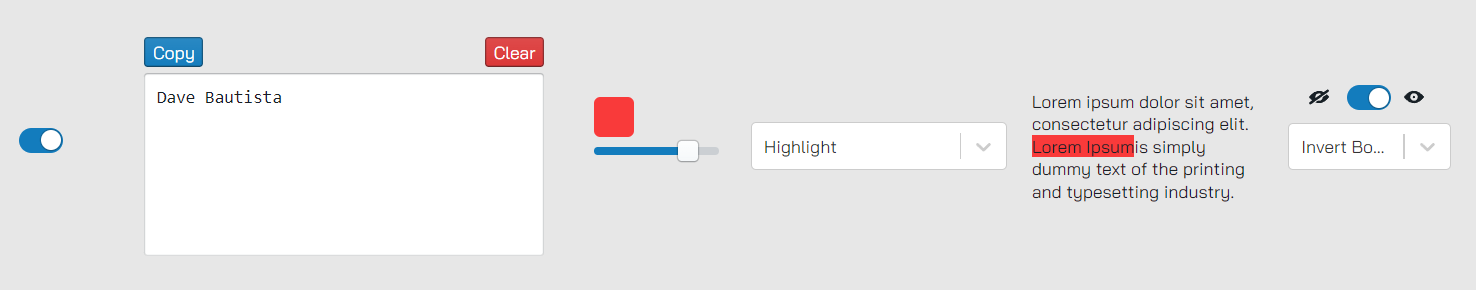
Adding highlight
After you’ve highlighted the object you’ll see (as expected) it appears in the relevant highlight list:
Removing highlight
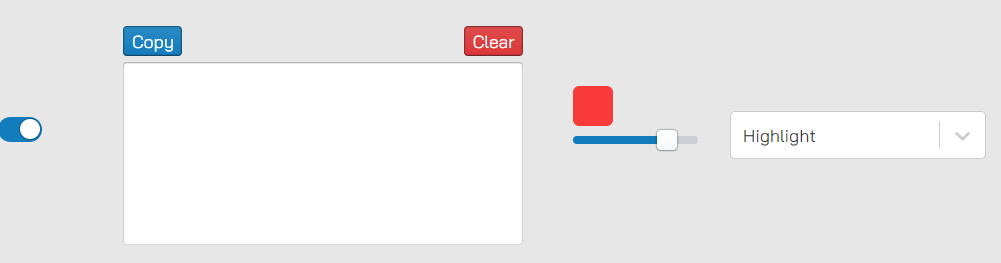
Once something is highlighted you can remove the highlight (if you knew it was there !!) in the same expected way. Here we show how you can do it on the list view, but it’s really the exact same thing on the graph:
As expected, the item is removed from the list.
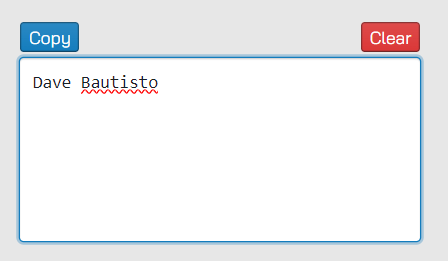
The party trick here is that when you change the text only slightly (Dave Bautista vs Dave Bautisto), the object does not get the tick mark anymore (this is expected… right?).
Webpage actions
A few new actions are introduced for webpages. The most interesting and useful one is:
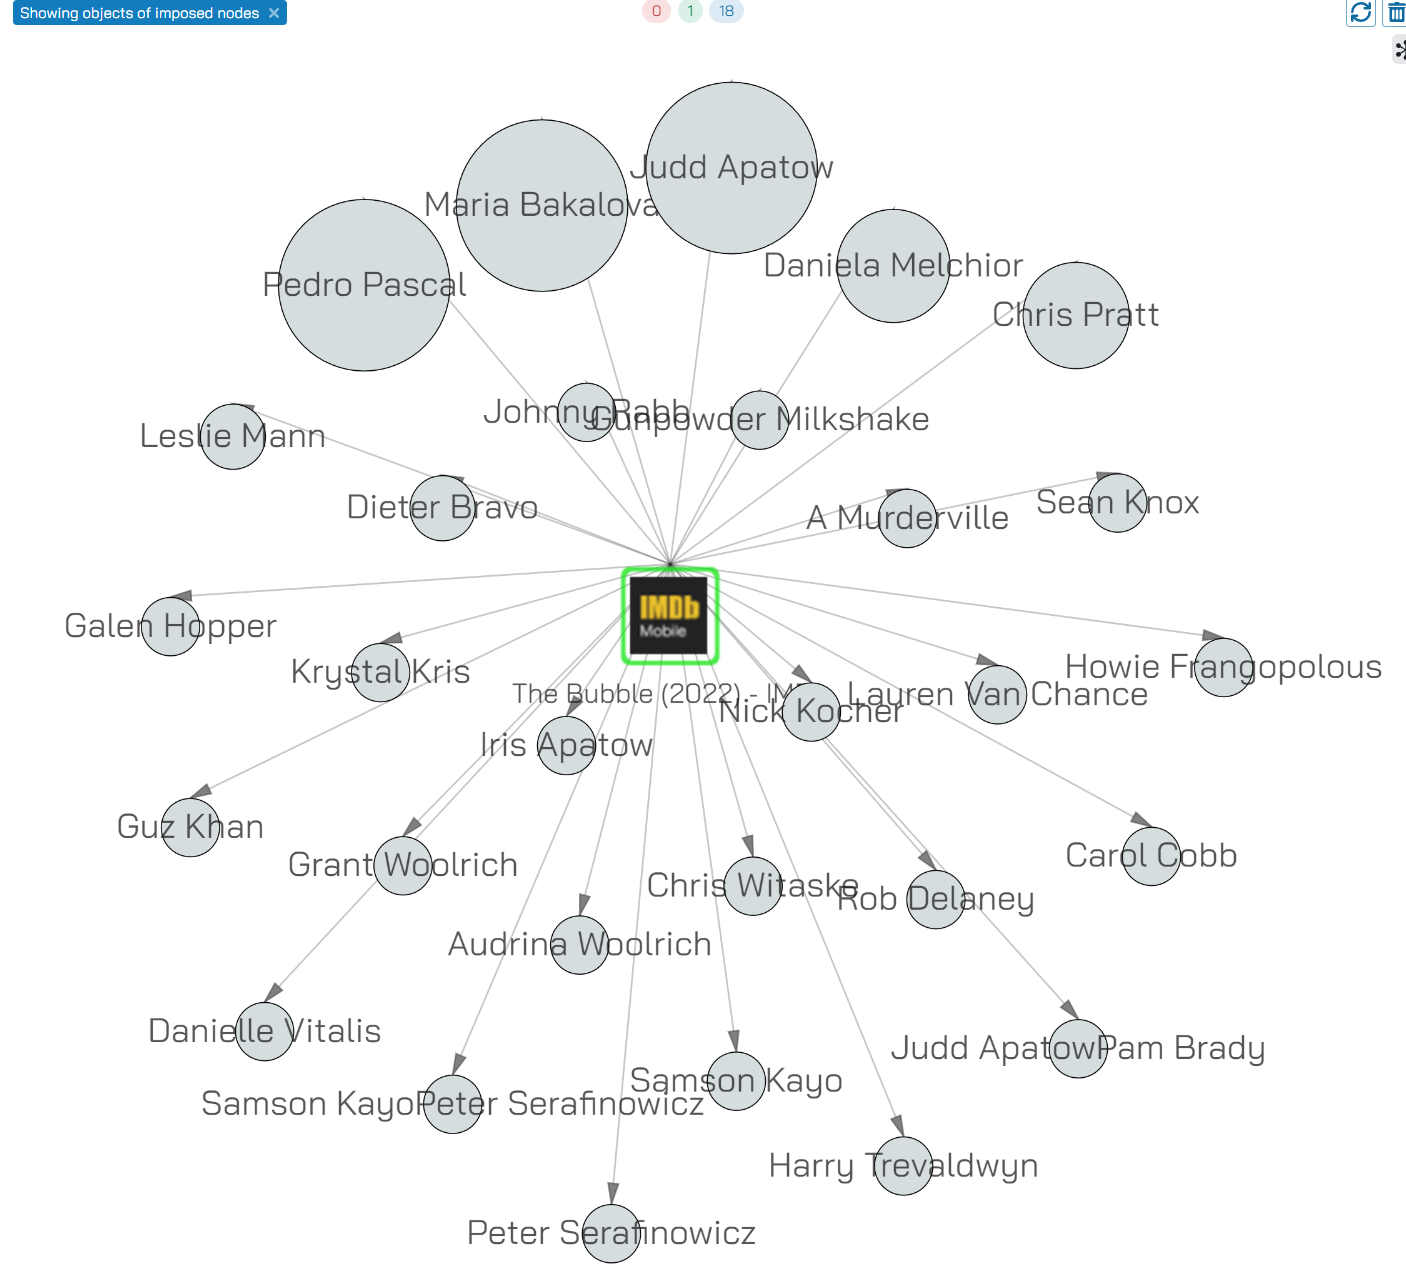
Show objects
This does what it says on the box, it shows you all the objects connected to a node. You can use this action from either the Object View or from the Navigation view.
This results in the graph below:
You will see that the nodes are sized according to how many other webpages (not shown) connect to them.